by Michael Reuter | 18 July 2014 | Blockchain
Working with lots of data, the biggest challenge is not to store or handle this data – these jobs are far from being trivial, but there are solutions for nearly any kind of problem in this space. The real work with data starts when you ask yourself: what’s behind the data? How could you interpret this data? What story can you tell with this data? That’s what we do and we want to share some of our findings with you and motivate you to join our discussion about the meaning of the data . We want to create Data Fiction.
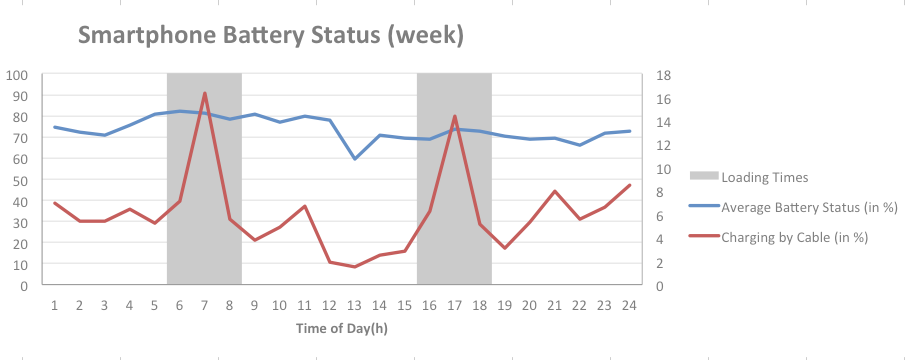
Today, we start with some sensor data collected by our explore app – the smartphone’s battery status including the loading process. Below you see sample data for our user’s behavior during the week (Feature Visual) and at the weekend (Figure 1).
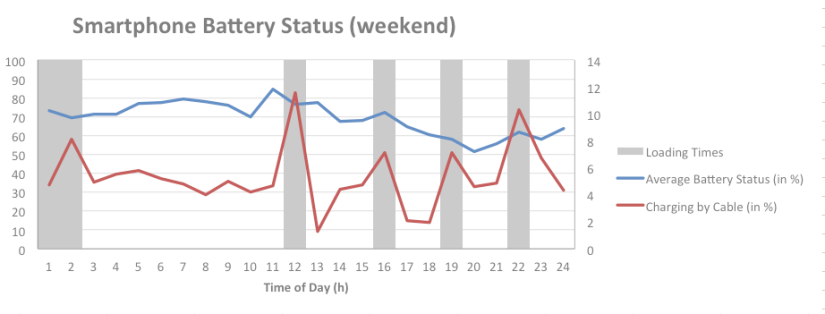
Figure 2: Smartphone Battery Status (weekend) (Datarella)
In Figure 1 you see that most users load their smartphones around 7 a.m. and (again) around 5 p.m. What does that tell us? First, we know when most users wake up in the morning – around 7 a.m.. Most probably they have used their smartphones’ alarm functions and then connect their devices to the power supply. Late afternoon, they load their devices a second time – probably at their office desks – before they leave their workplaces. During weekends, the loading behavior is different: people get up later, and maybe use their devices for reading, social networking or gaming, before they reconnect them to their power supplies.
Late rising leads to an avarega minimum battery status of 60% during weekends, whereas during the week, users let their smartphones batteries go down to 50%. This 10% difference is interesting, but the real surprise is the absolute minimum battery status of 50% or 60%, respectively. It seems that the days of “zero battery” and hazardous action to get your device “refilled” are completely over.
For some, data is art. And often, it’s possible to create data visualizations resembling modern art. What do you think of this piece?
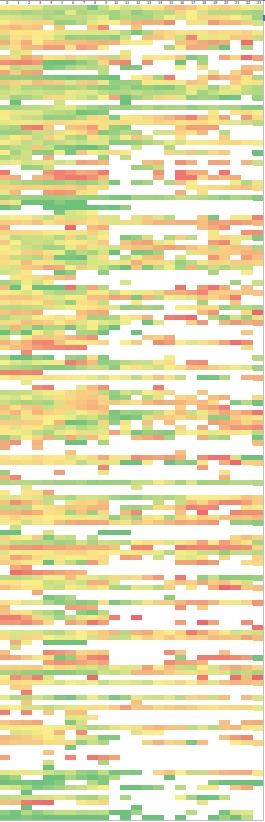
Figure 2: Battery Loading Matrix (Datarella)
This matrix shows the daily smartphone loading behavior of explore users per time of day. Each color value represents a battery status (red = empty, green = full). So, you either can print it and use it as data art on your office’s wall or you think about the different loading types: some people seem to “live on the edge”, others do everything (i.e. load) to staying on the safe side of smartphone battery status.
What are your thoughts on this? When and how often do you load your mobile device? Would you describe your loading behavior as “loading on the edge” or “safe? We would love to read your thoughts! Come on – let’s create Data Fiction!
by Michael Reuter | 15 July 2014 | Blockchain
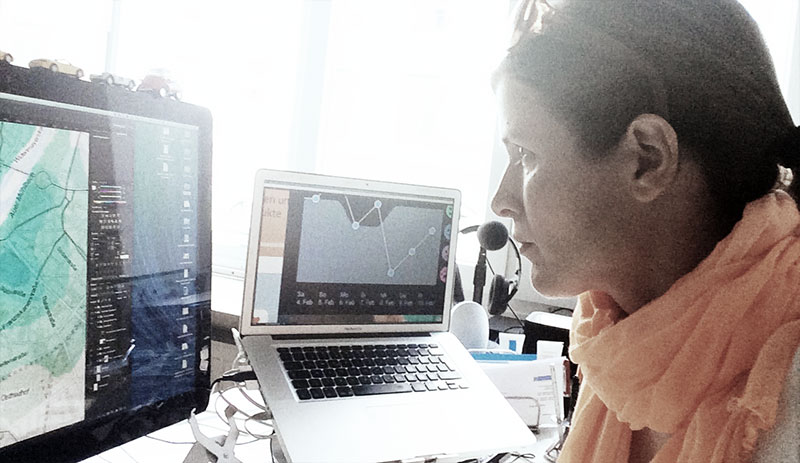
Today, we speak with Kira Nezu (KN), Co-founder of Datarella, about the design of the explore app.
Q
The explore app is available for Android smartphones only. What is the reason not to launch an iPhone version, too?
KN
We started to develop explore as a so-called MVP, a Minimum Viable Product. We chose Android to start with since it offers more variety regarding sensor and phone data. So we only test and make mistakes on one platform. At some point, we will also launch an iPhone version.
Q
explore consists of two different elements: the sensor tracking and the interaction area with surveys, tasks and recommendations. Could you tell us more about the structure and the functionalities of the app?
KN
With the MVP we are trying to stay as flexible as possible to enable fast changes and bug fixing. So we decided to create a hybrid app which incorporates native and web elements. The native part basically is the container with most of the graphics. The content is dynamically fetched from our backend, whereas the result area is fully created with web views. This brings great flexibility: we can update our content within minutes.
Regarding the structure there are 3 areas:
– main content area – divided into the survey area and recommendations,
– menu area,
– result area.
Q
Regarding surveys: there are already mobile survey apps on the market. How does the explore app differ from those?
KN
Before designing the app, we did a lot of research on existing survey apps. We found that either the apps had a very technical design that reminded us of Windows 95. Other apps were very playful but done simply, i.e. one app would show two images – and the user could tap one of those to make a choice.
We want the user to have a playful experience while keeping the flexibility of different interaction formats.
Q
You call explore a Quantified Self app. Can you elaborate on that?
KN
The Quantified Self aspect of explore relies on regular interactions wich ask the same information from the user. In the result area we show the user her personal mood chart with her own results compared to other explore users. Currently we are working on a location heat map in which the user can see her personal location history of the past days – and also that of other users. We had some surprise moments in internal tests: it took quite a while to recall why we were at certain locations. You could compare that with cooking water for tea 5 times before finally remembering to brew your tea.
Q
So what are the next steps for explore?
KN
We will focus on adding more Quantified Self elements as results as well as offer an API for users to play with their own data. We are really looking forward to see what our users will come up with! If you are interested with playing with your data now, you are welcome to participate in our Call for Data Fiction.
Q
Thank you very much.
by Michael Reuter | 10 July 2014 | Blockchain
Today, we speak with Yukitaka Nezu (YN), Co-founder of Datarella, about user interaction with the explore app.
Q
The explore app provides two key elements: sensor tracking and social interaction. You are responsible for the social interaction part. Could you tell us more about it?
YN
There are three different kinds of interactions among the editorial team and our users:
– Surveys
– Tasks
– Recommendations
With the surveys we ask our users about common trends and their everyday behavior. Answers are collected, analyzed and instantly presented in the feedback area. Based on the Quantified Self approach every single user sees her own results compared with other users.
Then, we run different programs helping people to simply feel better. One of our popular programs, SMILE!, motivates the user to start smiling herself and to animate others to smile, too, in return. On a daily basis, SMILE! participants receive tasks they have to fulfill. SMILE! participants managed to feel better after having finished the program and were happier compared with non-participants.
Last but not least, we provide two kinds of recommendations:
– General recommendations regarding health, fitness, nutrition, etc.
– Based on the individually collected sensor data as well as the answers to the surveys we issue personalized recommendations which help the user to increase their wellbeing and happiness
Q
Using explore for quite a while, I have seen many different interesting topics. How do you and your editorial team find these?
YN
We don’t invent things. We listen to the people. We read what they write, and talk. Then, there are seasonal topics of interest, such as national elections, or topics which are somehow linked to special dates. These days, one of the hottest topics is the Soccer World Cup in Brazil.
Q
Being provided with individualized recommendations seems very promising for the user. On the other hand – it sounds like a lot of work for your team. How is the user feedback on that? Do they like it?
YN
Yes, indeed, working on the interaction side of the explore app is the opposite of a part-time job: handling this huge amount of data and interacting with our users individually is a lot of work. However, we have developed tools supporting us in our analytical work. For example, there is our core instrument, the Complex Event Processing Engine CEPE. This engine automatically triggers certain interactions based on specific events; e.g. if a user enters a shopping mall, he will be provided with a coupon from a shop nearby.
The feedback we receive from people participating in our programs is very positive. Our users like the daily tasks – they are regarded as a welcomed distraction from their everyday routines. And, most of them confirmed that they have changed their behavior in a positive way. Above all, this behavior change aspect is the most important one for us: if you realize that your users really appreciate you work on the one hand and that they are successful in changing their behavior for the better on the other – then you know that you’re doing a meaningful job. It’s about creating meaning behind the data – and social relevance, after all.
Q
Thank you very much!
by Michael Reuter | 8 July 2014 | Blockchain
Too much workload, stress and ultimately the burnout – that’s how many people see their everyday life. One way to handle the negative aspects of daily routines is to make it to the weekend (TGIF), another is to go on vacation. Whereas the first tactic is easy to realize but only helpful to a certain degree, the latter is possible once or twice a year for most of us. But there is another, more easy way to calm down and to boost your wellbeing and happiness: create and repeat small positive experiences – and you will see an immediate effect on your overall awareness of life.
As Sonya Lyubomirsky and Kristin Layous show in their paper, based on research by Ed Diener and others, it’s the small and regularly repeated positive experiences which influence your wellbeing and happiness to a great extent. According to the Positive-Activity Model, features of positive activities, including their dosage, variety, sequence, and built-in social support, all influence their success in that process.
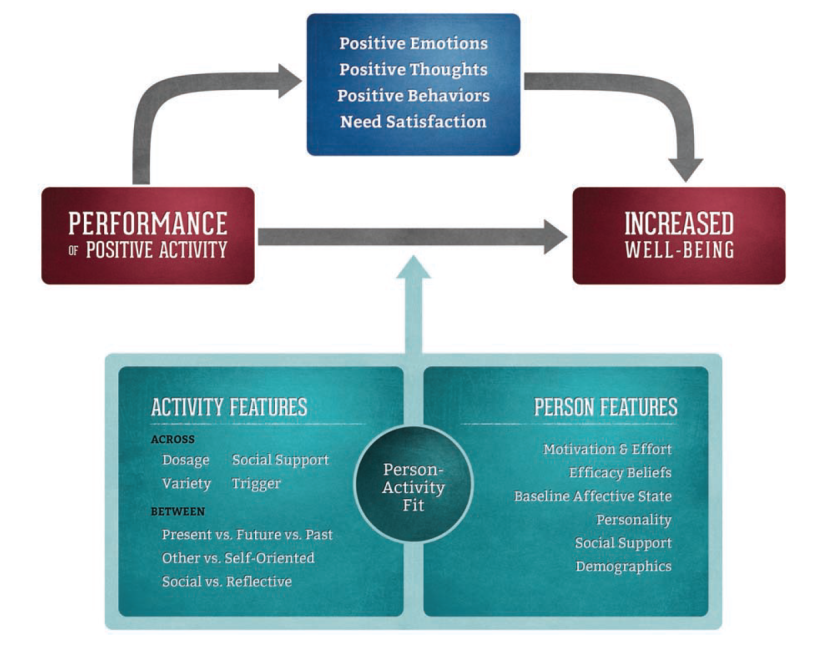
Positive-Activity Model
For our editorial team at Datarella, this model was a challenge: how could we use the explore app to get this model work in an optimal way? As always, the team decided not to head for the optimal – but for a good solution, to invite volunteers to participate in a special program and ultimately to optimize the program together with the explore users. This program, SMILE!, should be designed very lean, with just a minimum number of interactions, and with an active participation for just a few days, in order not to interfere with the model’s cause-and-effect relationships.
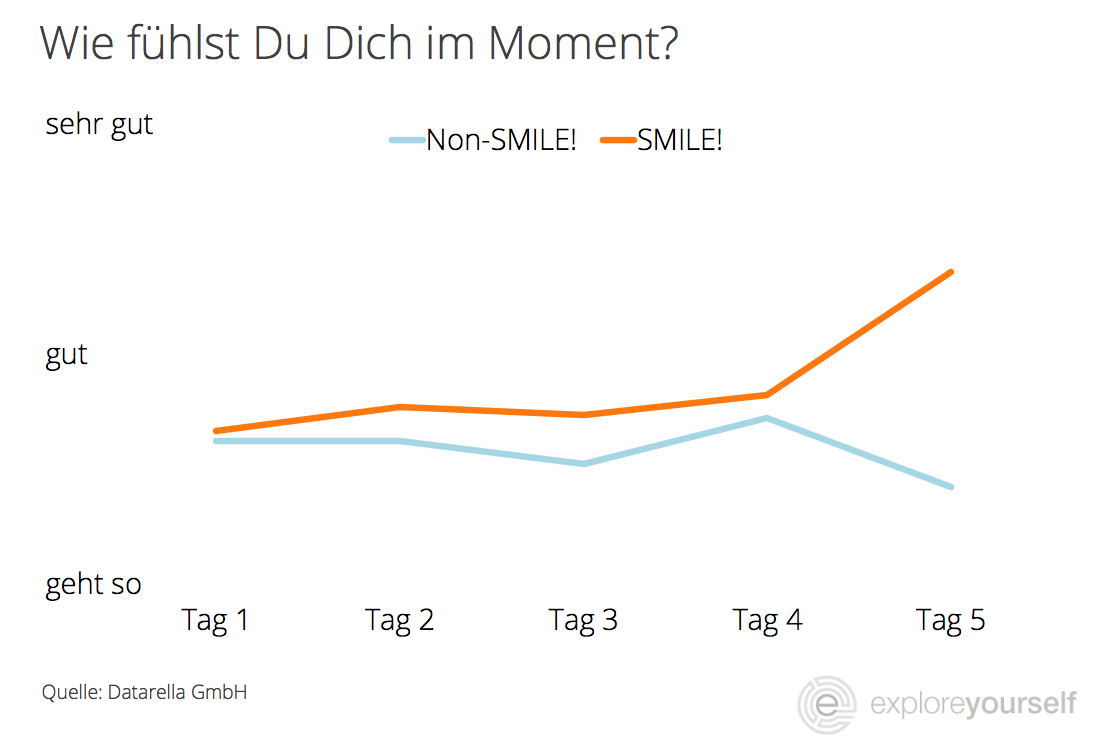
After the 5-day-program, our data team analyzed the results. In short: our findings completely back the findings of Ed Diener et al.:
- participants of the SMILE! program experienced a significant increase of their happiness with each additional day during the program
- participants of the SMILE! program experienced an increase of their happiness compared with a test group of non-participants whose happiness level remained constant
- small, regular and well-portioned challenges triggered a change of the participant’s behavior resulting in an increased happiness level
The two charts below demonstrate the SMILE! effect:
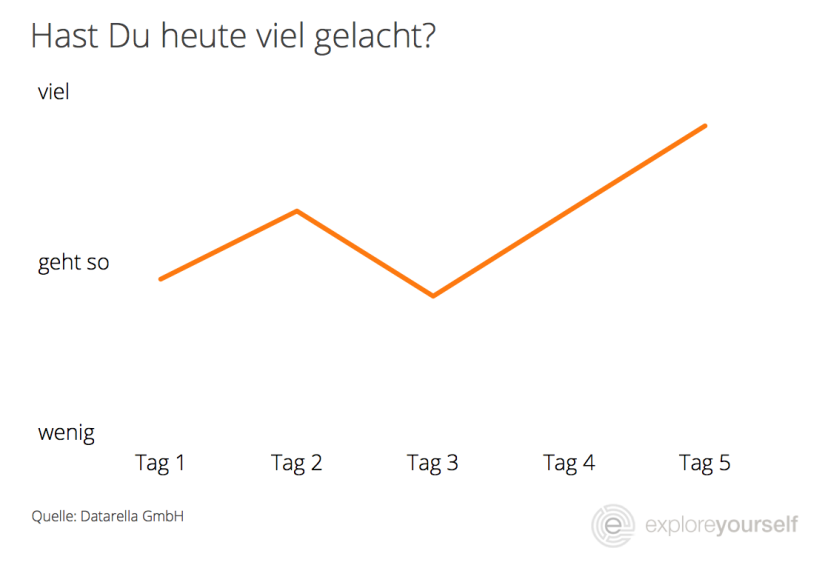

(For non-german speaking users: Translation Chart 1: “Did you laugh a lot, today?”, Translation Chart 2:”Do you think that you laughed more often at the end of the program?”, Translation Feature Visual:”How do you feel at the moment?)
The Datarella team itself participated in SMILE!, too. For me personally, it was a great experience. Being an optimistic guy and smiling often, the SMILE! challenges opened my eyes: in reality I have been smiling much less than I had thought. And triggered by the SMILE! challenges I was forced to become much more friendly.
For Datarella, the SMILE! program was a first test. We are planning to roll out several programs of this kind, all of them aiming to boost personal wellbeing and happiness. Since our editorial team is still in the process of creating these programs we’d like to invite you to participate and add your ideas, proposals and thoughts! We’d love to hear from you!
by Michael Reuter | 7 July 2014 | Blockchain
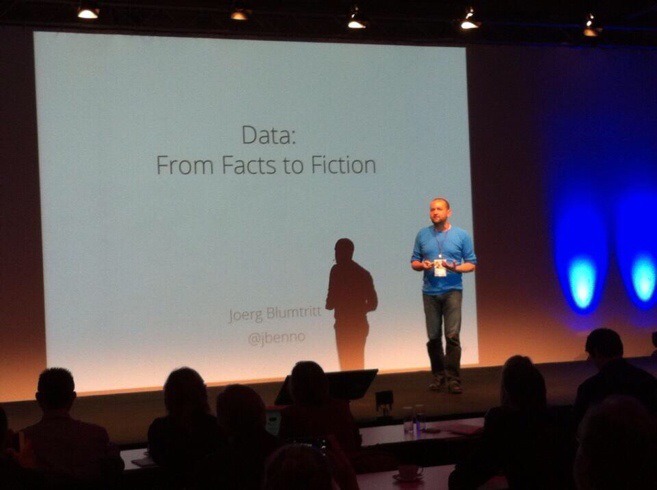
Today, we speak with Joerg Blumtritt (JB), CEO and Co-founder of Datarella, about product development based on Big Data.
Q
What is so special about product development based on Big Data?
JB
Big Data is not so much about technology, it’s more about letting go your traditional business practices: where you used to differentiate between data and meta data or between master data and transitional data, you now just see …. data. If you take Social Media data for example, the old way of analyzing things would have been taking the texts of postings a data and time stamps, geolocation, the profile of the author, etc. as meta data. However, for most contexts, it’s far more valuable to analyze the connections of different authors or it might be even more telling to include the geolocations to reveal the true meaning of the posting without understanding a single word of the language it as written in (BTW: this is how the NSA does Social Media monitoring)
The second aspect of this is not to work hypothesis-driven, but in an explorative way: don’t restrict yourself by narrowing the scope – instead analyze all given variables.
Q
You mentioned Social Media monitoring. In times of everybody being an author and adding content to the internet on a daily basis – is there still a need to know even more about “the user”?
JB
Data is made of people. Mass customization, for the first time, is not a buzzword disguising half-baked services or products. Now we have the means to stop aggregating people and to deal with each person individually.
Q
Regarding the paradigm shift of not building hypotheses first but collecting analyzing all data: isn’t then former US State Secretary Donald Rumsfeld the real inventor of Big Data analysis by pointing to knowns, unknowns, unknown unknowns, etc.?
JB
The known knowns in Rumsfeld’s narrative are classic dashboards, where only information from your data warehouse gets displayed – which already is known. Big Data really is about the unknown unknowns. However, there are also unknown knowns – things like social conventions, moral restraints, etc. that bias our perspective.
Q
Product development typically requires stable company structures and efficient processes. Now we have this paradigm shift and with it – instability and untested processes. What is the most important aspect of product development based on Big Data?
JB
Keep your product in permanent beta. Publish fast, collect all information how your product is used by its users, and constantly update with what you have learned.
Good product development with Big Data means being agile, iterative and lean and focusing on the Minimum Viable Product MVP instead of feature-laden products. Always A/B test: present small variations of your product to random samples of users and check if variations increase the value of your product.
Q
Ok – so we have a lean startup process here. But – where to get ideas from in the first instance?
JB
My favorite quotation for this is:
Never look into the past – it only distracts from the future!
by the Incredible Edna ‘E’ Mode.
Business intelligence only tells you what is already there. so look to other industries to get inspired: take Google or Tesla entering the car manufacturing industries: both have been software and services companies disrupting a classic industry. The full product development cycle to build a robotic car factory from an old used one to drive in a compelling electricity-powers sportscar took Tesla less than 2 years. Compare that with literally decades it takes to develop one of the classic road dinosaurs.
Q
To sum it up:, your recommendation for an optimized Big Data product development process is: never underestimate attacks from completely different industries, collect and analyze all available data in a very lean way and get your product out early to learn from your customers.
JB
Exactly.
Q
Thank you very much!
by Michael Reuter | 1 July 2014 | Blockchain
DATA FICTION – THE STORIES BEHIND THE DATA
Do you read science fiction? Can you make data interesting? Can you tell the story behind a pool of data? Are you a data fictionista? Submit your data fiction.
People, animals, plants and things produce data – a lot of data. The data itself is the basic resource – like words are the basis for language. If you put words together to sentences and you combine sentences to chapters and aggregate several chapters – you write a story, you create fiction. Same with data: if you combine different data sources to data pools and aggregate them – you write the story behind the data, you create data fiction.
[Strong narrative] augments the available data by way of context, and extends the patience of the audience by sustaining their interest as well.
Does that sound like you?
We’d love to see and discuss your applications, analyses, case studies and models with you and help you make your data fiction become reality.
DATA, APP & COMPLEX EVENT PROCESSING ENGINE
The Data
We will provide you with sample data resulting from the usage of our explore app.
The App
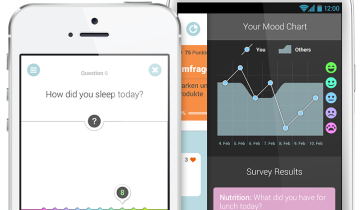
The data has been created by users of the explore app. In explore, the user interacts by answering surveys, attending tasks and heeding valuable recommendations based on her behavior. She immediately sees the results of her interactions in the feedback area. Second, explore tracks several sensors of the user’s phone, which can be set on and off by the user herself (see full list of sensors below). explore connects both areas, interactions and the sensor tracking area, with the integrated Complex Event Processing Engine CEPE.
The Complex Event Processing Engine (CEPE)
The CEPE is a mechanism to target an efficient processing of continuous event streams in sensor networks. It enables rapid development of applications that process large volumes of incoming messages or events, regardless of whether incoming messages are historical or real-time in nature.
Our CEPE is based on ESPER and Event Processing Language EPL
List of Sensors
– GPS location data
– Network location data
– Accelerometer
– Gyroscope
– Wifi
– Magnetic field
– Battery status
– Mobile Network
REQUIRED
– Overview and extended description or representation of your main idea, any subtopics and a conclusion
– Use or integration of at least 1 (one) category of sensor data (e.g. Gyroscope). If you use GPS location, you should use or integrate at least 1 (one) additional category of sensor data beside GPS location data.
DATA FICTION TYPES
– Presentation
– Video
– Installation
RESULTS
We will reward fascinating data fiction with preferred access to our data, a post on the QS Blog and the possibility of making data fiction come true.
Yes, I am a data fictionista and want to submit my data fiction!
by Michael Reuter | 3 June 2014 | Blockchain
Do you know your Vitamin D level? Did you know that your Vitamin D Level has a great influence on your wellbeing? Living in northern Europe or Canada, you are at risk for vitamin D deficiency. Vitamin D is known as the sunshine vitamin, but it also occurs in some foods, including fish, eggs and dairy products.
As an adult, you should ingest at least 20 micrograms of vitamin D per day. To prevent diseases, such as multiple sclerosis or cancer, even significant higher doses are recommended. If you go for walks or exercise outdoor on a daily basis, you already do a lot for a healthy vitamin D level. If you are more the manager type, sitting indoor all day and use a car or other “indoor” means of transportation instead of riding your bike, you probably should supply your body with an extra portion of vitamin D.
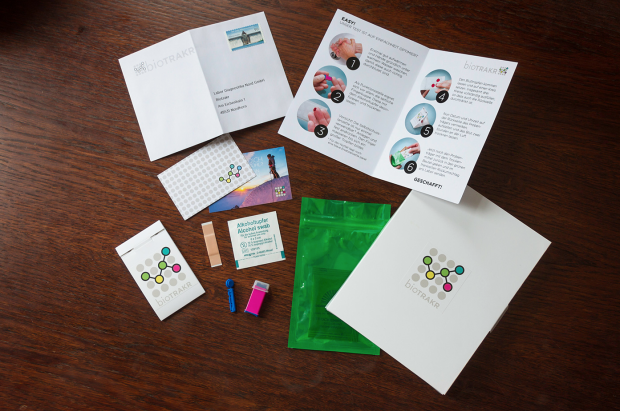
Starting by the end of June, we will run a field study with our explore app and we would like to invite you to participate. Together with our partner biotrakr, a Berlin-based health startup, we will check your vitamin D level: you will get our blood test kit with which you can take a sample of your own blood. Additionally, you should answer a special vitamin D interaction in the explore app. A few days after having finished the interaction and having sent the kit back to our laboratory, you will be provided with your lab results in a personal area of the biotrakr website. The results of the vitamin D interaction will, as usual, be presented in explore itself.
In this short video the blood test is explained (German):
The vitamin D check-up will be supervised by Dr. med. Astrid Vidal, who runs doctor’s offices in Weilheim and Rosenheim, Germany.
How can you participate in the vitamin D check?
On Wednesday, June 11, you can answer our interaction “Vitamine” in the explore app. If you answer the last question with “Yes” and you are one of the very first 25 applicants, you are in! You will be informed via a personalized “Tipp” in explore. This first vitamin D check will be in German language only. If you prefer to participate in English, you’ll have to wait for the next check, wich will be offered in both languages.
The vitamin D check:
Delivery of blood test kits: between June, 16 – 20
Return of blood test kits to laboratory: latest June, 27
Answering of vitamin D interaction in explore app: until June, 27
Results in explore app: immediately after having finished the interaction
Results of laboratory blood test: July, 4
Participants: max. 25
Terms & conditions: You may participate in the vitamin D check if you are one of the first 25 explore app users who apply for the check in the published interaction “Vitamine”.
We are looking forward to run this vitamin D check together with you and to compare the results of the laboratory blood test with the interaction in explore.

by Michael Reuter | 26 May 2014 | Blockchain
What unites poets, philosophers, psychologists, neurologists and economists? They all are interested in what makes us happy. Sure, they have their distinct perspectives: one is interested in people’s feelings, the other wants to know what people value and the latter is interested in how people’s brains respond to rewards. Even governments try to measure and increase the happiness of their citizens.
Measuring happiness is easier than you might think. First, we can ask people how they feel and have them rate that feeling on a scale. That’s what we do with our explore app day by day. Second, we can use MRI to measure blood flow in the brain, or EMG to evaluate and record the electrical activity produced by our skeletal “smile” muscles in the face. Very often, the results of the easy survey and those of the biomechanic treatments are highly correlated – that’s why we’re pretty content with our explore interaction results.
Then, there is this difference between synthetic happiness and real, or natural, happiness. We produce synthetic happiness when we don’t get what we want. The reason: things have less impact on happiness than we expect them to have. It seems that most experiences – bad and good ones – affect us for no longer than three months. Still, even synthetic happiness deserves to be regarded of equal value as the real happiness: people producing synthetic happiness don’t necessarily delude themselves but they find things that are even better than those they had before. Just think of those of us having chosen not to stick to their careers (they wouldn’t have become CEO, anyway), but to spend more time with their families.
If you had to summarize all the scientific literature on the causes for happiness in one word, it would be ‘social’. To tell something about a person’s happiness, we should know about her social graph, her family, her friends, and the strength of the network’s connections: the more people feel welcomed, accepted and loved, the happier they are.
So – what about the weakest links of your social network? What about the people you see, meet or with who you have social encounters in one way or the other, day by day? Didn’t that woman stare at you? Why do these guys laugh after having looked at you? Why does the young man frown and shake his head constantly? We all ask ourselves questions like these. And the answers influence our own behavior and wellbeing, to a greater extent if our wellbeing mainly depends on our outside world, less if we have learned to build a strong foundation of our own wellbeing. The good thing about external effects on our happiness is that we aren’t exposed to them without active input from ourselves: we can influence these effects, we can even trigger them. Take some minutes and watch this video by Christine Rabette:
What do we see? Passengers in a Belgian metro are infected by the laughter of a single man. Watching this short film, one thing seems to be pretty evident: laughter is contagious. Not only – everyone will be laughing after a few minutes, but each individual seems to feel relieved. Each person seems to laugh about his or her own rather gloomy attitude before this funny guy started laughing. And don’t we know that feeling? Using public transport, on our daily way to work – the looks of many of us range from earnest to gloomy. So – what about a smile, what about the effect of laughter on happiness? Does smiling at people make them happier? Does smiling make yourself happier?
Ron Gutman, Founder and CEO of HealthTap, certainly thinks so – you can persuade yourself watching the video below – whereas others like John M. Grohol, Founder and CEO of PsychCentral, are more skeptical – especially regarding the mixing up of correlations and causations.
There is one very interesting finding in the work of Ed Diener who shows that the frequency of our positive experiences is a much better predictor than the intensity of our positive experiences. In other words: the more often you can produce positive experiences the happier you will feel. And since most of our daily social contacts take place in our extended social network, using rather weak links, such as “I have seen this person” or “she asked me for directions”, it might make a lot of sense if we focus on exactly these ‘weak’ experiences of communication and try to transform them into positive experiences. Keep in mind: the more often you have positive experiences, the happier you become.
As regarding happiness, a lot of scientific work has been done exploring the effects of a smile and I’ll show some of the results in one of my next posts. In a nice co-incidence, it now seems scientifically proven that a sense of humor can improve our health!
But for the moment I’d like to invite you to our experiment SMILE! – a 5-day-program based on the explore App helping you to start and keep smiling (at others) – and therefore creating several additional positive experiences a day. We invite you to participate and to check whether you will have become happier after 5 days. If you want to participate, just answer “Yes” in the interaction “Happiness” which will be published on June, 4, in explore. The first 25 volunteers are in!
by Michael Reuter | 23 May 2014 | Blockchain
At the Quantified Self Conference 2014 in Amsterdam, I attended a breakout session with the promising title “The Future Of Behavior Change”, moderated by Lukasz Piwek, a Research Fellow in Behavioral Change at the Bristol Business School.
Our curious and engaged crowd discussed that matter extensively and – unsurprisingly – left the session with more questions than answers. But: “it’s not about the answers, it’s about find more questions. Answers are so temporary”, as Ernesto Ramirez, the Quantified Self Lab’s Program Director elegantly tweeted. As a good researcher, Lukasz himself offered some possible answers but concluded that definitely more research is needed.
Based on his studies at Bristol Business School, he thinks that these factors lead to a lack of long-term user involvement while using Quantified Self tools, which is a major condition for behavior change:
– Lack of data validity and reliability
– Oversimplification of inferences
Regarding his first point, I take the risk of completely ignoring (his) research and putting my shirt on good judgement (which I usually avoid to do): I claim that people don’t bother at all, ignore any scientific shortcomings and look for comprehensibility and usability of Quantified Self tools: as long as variances of results; e.g. number of steps taken or burned calories stay small, users will accept them and stick to these tools. As often, critics as experts or journalists, point to flaws in technology, but individual users remain unaffected. We see this behavior in many seemingly sensitive topics, such as the privacy discussion. My guess would be: ask a hundred users if they are concerned about validity or reliability of collected data, and 95 would say “no”. We will do that via our explore app and I’ll hand the results in later.
Lukasz’ second finding is a bit more challenging. I must admit that I’d prefer to base my claim on reasonable data. And yet, I don’t believe in this finding either: most people I know – during the session Carine Coulm introduced the term ‘normal people’; and I refer to exactly these people – prefer simplification over complex relations. They want the world to be explained to them, to be constructed, rather than some analytic and deconstruction work creating more problems than results. Most people want simple solutions. Therefore, I suspect that users of quantified self tools have to experience simple (positive) results in order to stay motivated.
At the 2014 M-Days conference, Frank Kressmann of Braun GmbH, a Procter & Gamble subsidiary, presented the first interactive electric toothbrush. It communicates via Bluetooth with an app, shows how long a user has been brushing her teeth, and gives some recommendations on the optimal pressure on the toothbrush head. P&G had 8,000 users tested this toothbrush who really seemed enjoying their oral hygiene: they extended their average duration of brushing their teeth from 45 sec to 2 min and 16 sec, a 300% change. Obviously, there’s an enormous impact of making a toothbrush interactive – it results not just in a minor, but in a significant behavior change.
Which brings me to the title of this post: Could we learn all about behavior change by simply applying some makeup?: Imagine Whitney, dressing herself up for tonight’s party. Before Whitney will leave her house she puts on her make-up. She does that in front of her mirror. At some point, she decides that it’s enough and she’s satisfied with what she sees in the mirror. She is ready to go.
Here are the ingredients of that behavior:
– Goal: looking good for tonight’s party
– Means: the makeup
– Control and measuring module: the mirror
– Feedback loop: many small make-up actions and their results
– Benchmark: Whitney’s look before vs after makeup
– Result 1: looking good
– Result 2: compliments from her friends
With her first glance into the mirror, Whitney realizes that she wants to enhance her look. (Maybe she doesn’t but for my example I need her to do so.) By knowing the instrument for an action which will change her look for the better, using the instrument and experiencing immediate effects of her actions, Whitney learns that specific actions lead to required results.
Couldn’t we therefore simply add mirrors to people’s daily behavior in order to motivate them to change their behavior? It doesn’t have to be real mirrors; it could be a tool mimicking the function of a mirror, such as an app which asks her user things about her actual behavior. Or an app like the one connected with the toothbrush – which mirrors the cleaning of its user’s teeth. The user would then be reminded of her actual behavior and “see it” like she would see it in a mirror. Do you yourself use a mirror on a regular basis? Which kind of mirrors (in a metaphorical sense) could you imagine?
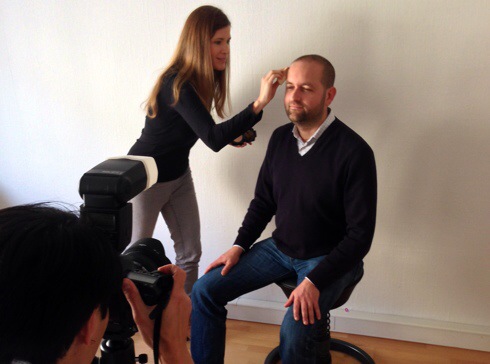
I’ll elaborate on behavior change in forthcoming posts. But for moment, I encourage you to put on some makeup (as our CEO Joerg in this post’s feature visual, by courtesy of Kira, photographed by Yuki) in front of your mirror and share the results with us!


