Working with lots of data, the biggest challenge is not to store or handle this data – these jobs are far from being trivial, but there are solutions for nearly any kind of problem in this space. The real work with data starts when you ask yourself: what’s behind the data? How could you interpret this data? What story can you tell with this data? That’s what we do and we want to share some of our findings with you and motivate you to join our discussion about the meaning of the data . We want to create Data Fiction.
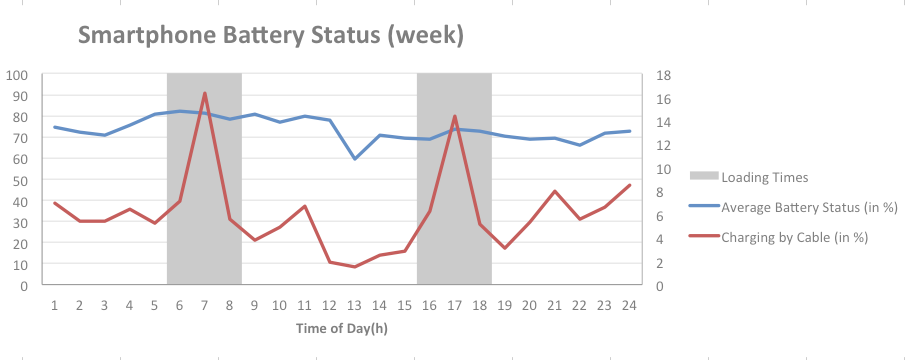
Today, we start with some sensor data collected by our explore app – the smartphone’s battery status including the loading process. Below you see sample data for our user’s behavior during the week (Feature Visual) and at the weekend (Figure 1).

Figure 2: Smartphone Battery Status (weekend) (Datarella)
In Figure 1 you see that most users load their smartphones around 7 a.m. and (again) around 5 p.m. What does that tell us? First, we know when most users wake up in the morning – around 7 a.m.. Most probably they have used their smartphones’ alarm functions and then connect their devices to the power supply. Late afternoon, they load their devices a second time – probably at their office desks – before they leave their workplaces. During weekends, the loading behavior is different: people get up later, and maybe use their devices for reading, social networking or gaming, before they reconnect them to their power supplies.
Late rising leads to an avarega minimum battery status of 60% during weekends, whereas during the week, users let their smartphones batteries go down to 50%. This 10% difference is interesting, but the real surprise is the absolute minimum battery status of 50% or 60%, respectively. It seems that the days of “zero battery” and hazardous action to get your device “refilled” are completely over.
For some, data is art. And often, it’s possible to create data visualizations resembling modern art. What do you think of this piece?
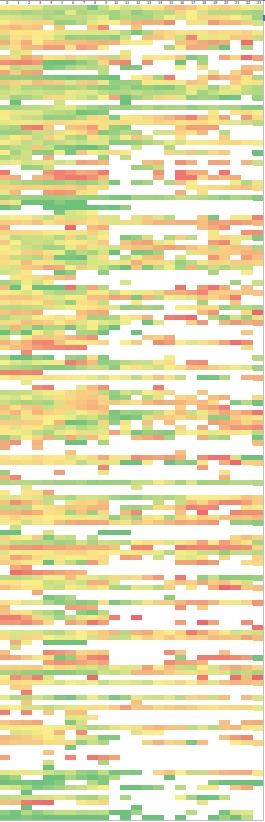
Figure 2: Battery Loading Matrix (Datarella)
This matrix shows the daily smartphone loading behavior of explore users per time of day. Each color value represents a battery status (red = empty, green = full). So, you either can print it and use it as data art on your office’s wall or you think about the different loading types: some people seem to “live on the edge”, others do everything (i.e. load) to staying on the safe side of smartphone battery status.
What are your thoughts on this? When and how often do you load your mobile device? Would you describe your loading behavior as “loading on the edge” or “safe? We would love to read your thoughts! Come on – let’s create Data Fiction!