by Michael Reuter | 16 February 2015 | Blockchain
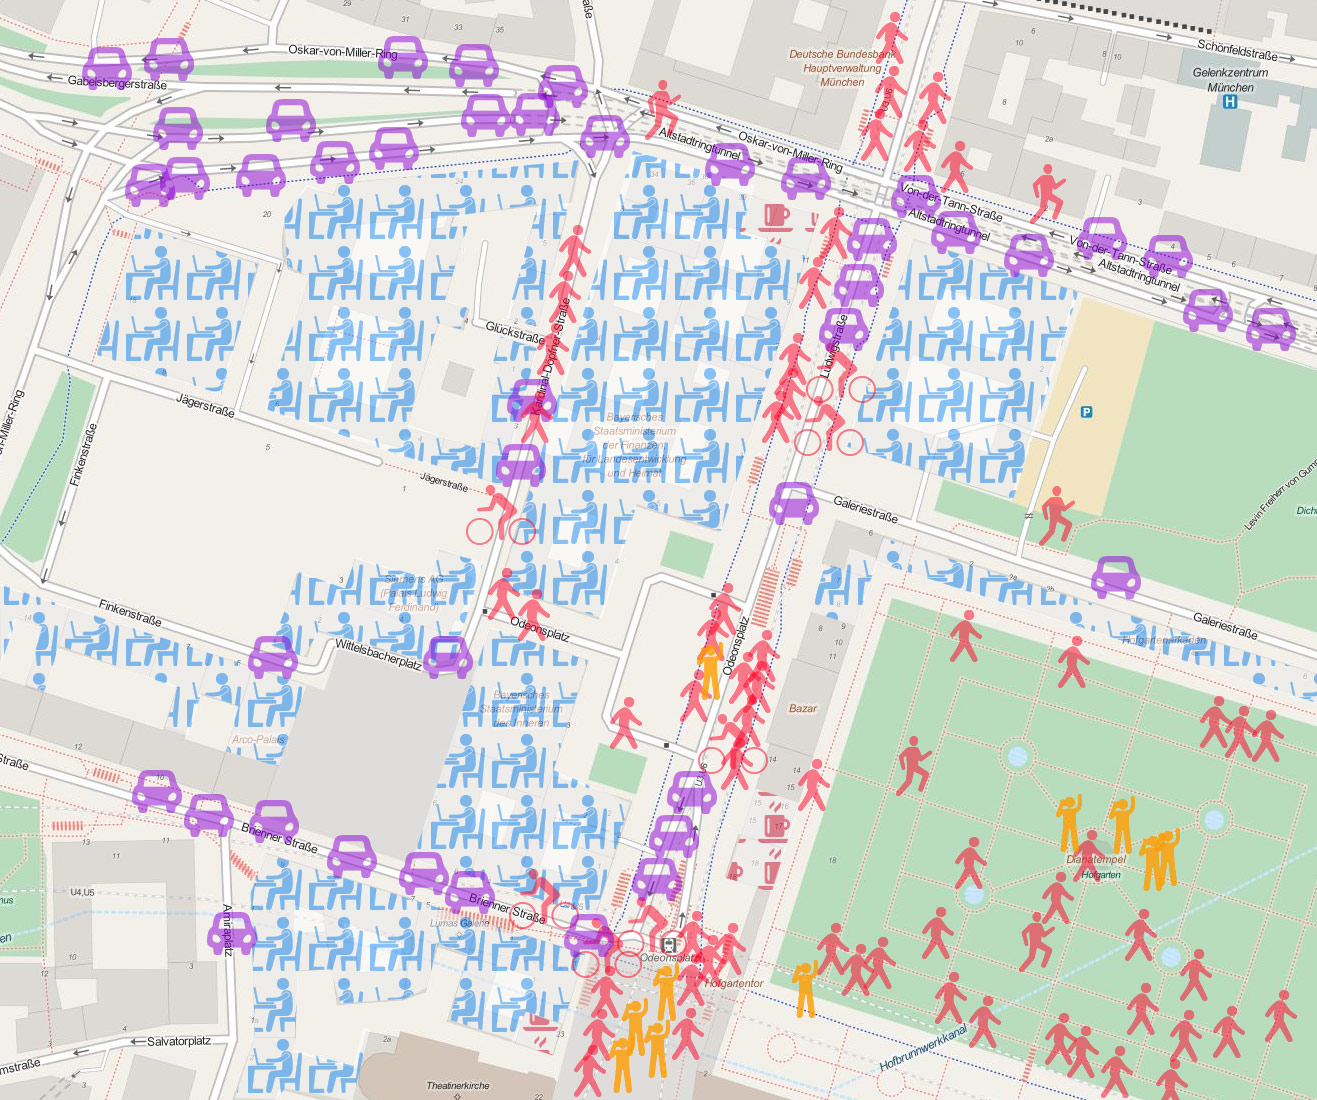
Every smartphone user produces more than 20 MB of data collected by her phone’s sensors per day. Now, imagine the sensor data of 2 billion smartphone users worldwide, translated into realtime human behavior, shown on a global map. That is the vision of the Datarella World Map of Behavior.
A typical 2015 generation smartphone sports up to 25 sensors, measuring activities as diverse as movements, noise, light, or magnetic flux. Most smartphone users aren’t even aware of the fact that their phone’s camera or microphone never are really “off” but that they constantly collect data about the noise level or the intensity of light the user is experiencing.
Actions speak louder than words
Actions speak louder than words – if we want to really know a person we have to know how she behaves, and not only what she says. And that’s not only true for politicians. We all form our opinions on others by looking at their actions, more than their words. Many inter-personal problems result from NOT looking at people’s actions, but focusing on other aspects, such as their looks or their words. Behind superficial distinctions such as physical appearances, over time we often realize similarities with other people based on their and our actions.
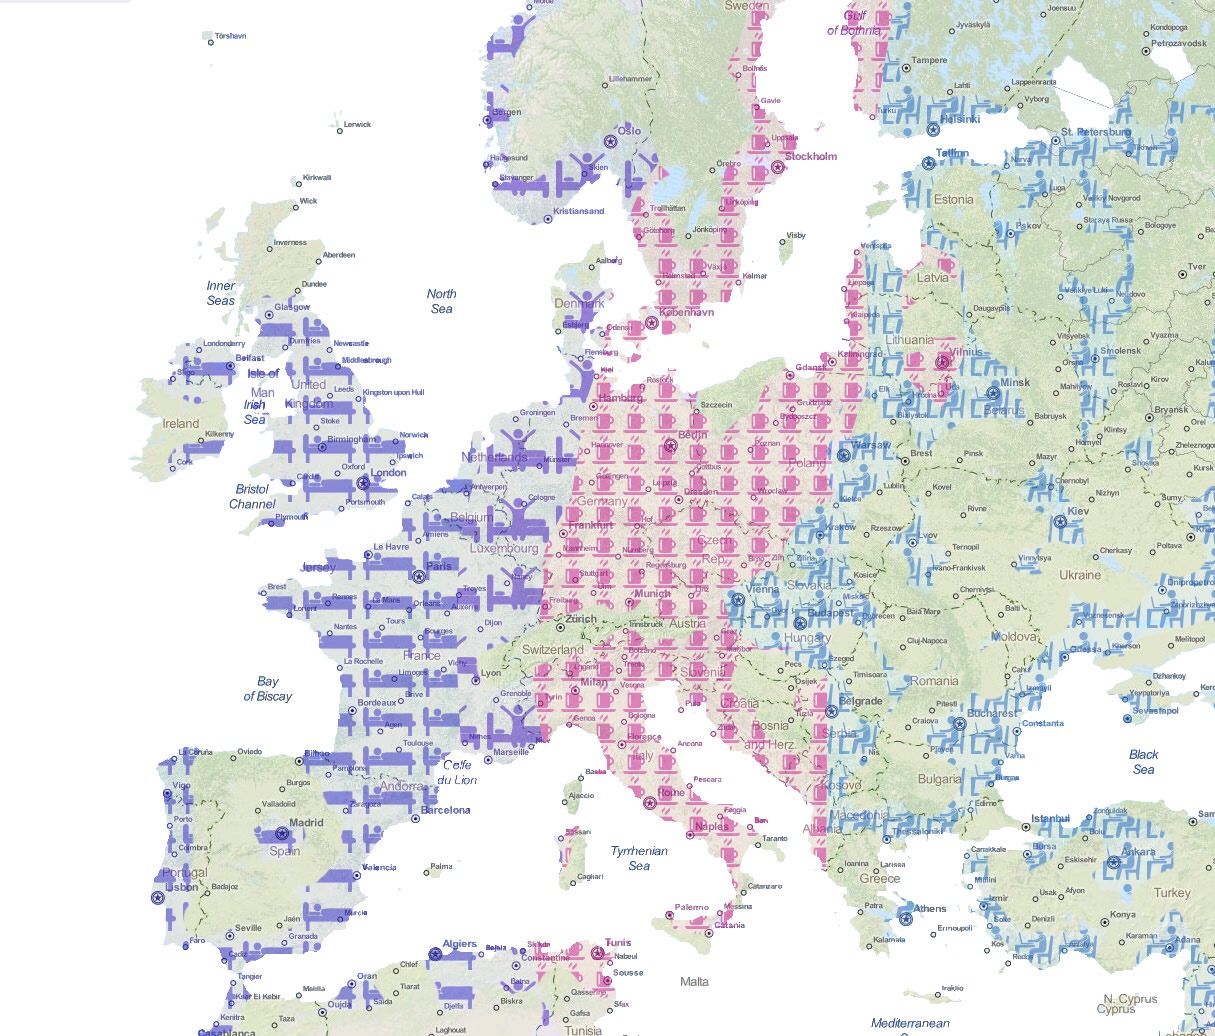
Our vision of a World Map of Behavior
At Datarella, our vision is to show the actions of people around the world on a global map. By displaying the actions of people of all continents, we want to tell stories about the differences and similarities of global human behavior – to draw a picture of human co-existence. There already are snapshots of global behavior, provided by data focused companies, such as Jawbone, who map sleep patterns worldwide. From that we know that Russians get up latest, and Japanese get the least sleep in total . And there are different behavior-related maps, showing the world’s most dangerous places, defined by the number and seriousness of crimes or actions of war.
Co-operation & Participation
To create the World Map of Behavior is our ambitious project for 2015 that we won’t complete alone. We need your support: if you are an expert in the field of mobile sensor data or if your company already focuses on collecting and interpreting mobile sensor data in the fields of mobility, finance, health or transport and travel. If you are interested to play a role in this project, please send us an email with a brief description of how you would like to contribute. We are looking forward to hearing from you!
by Michael Reuter | 14 February 2015 | Blockchain
If you live in the Americas, Europe, Asia-Pacific or Australia, you probably are one of 1.76 billion smartphone users. What do you do with your smartphone? You use apps for texting, social networking, gaming, etc. And you produce data. Lots of data. Every move you make, every breath you take, your behavior results in data: location, movement, body functions, external situational data. And you produce all this data on the fly, passively, without any effort.
But where is this data? Can you see it? Do you know exactly which data you produce? At which times or to what extent? Do you know that your data can be of tremendous value for you? That you can improve your health by using it? Can you imagine knowing all about your data, that you see your data, in realtime, presented in a meaningful way that lets you understand its value?
Welcome to the Datarella Data Timeline
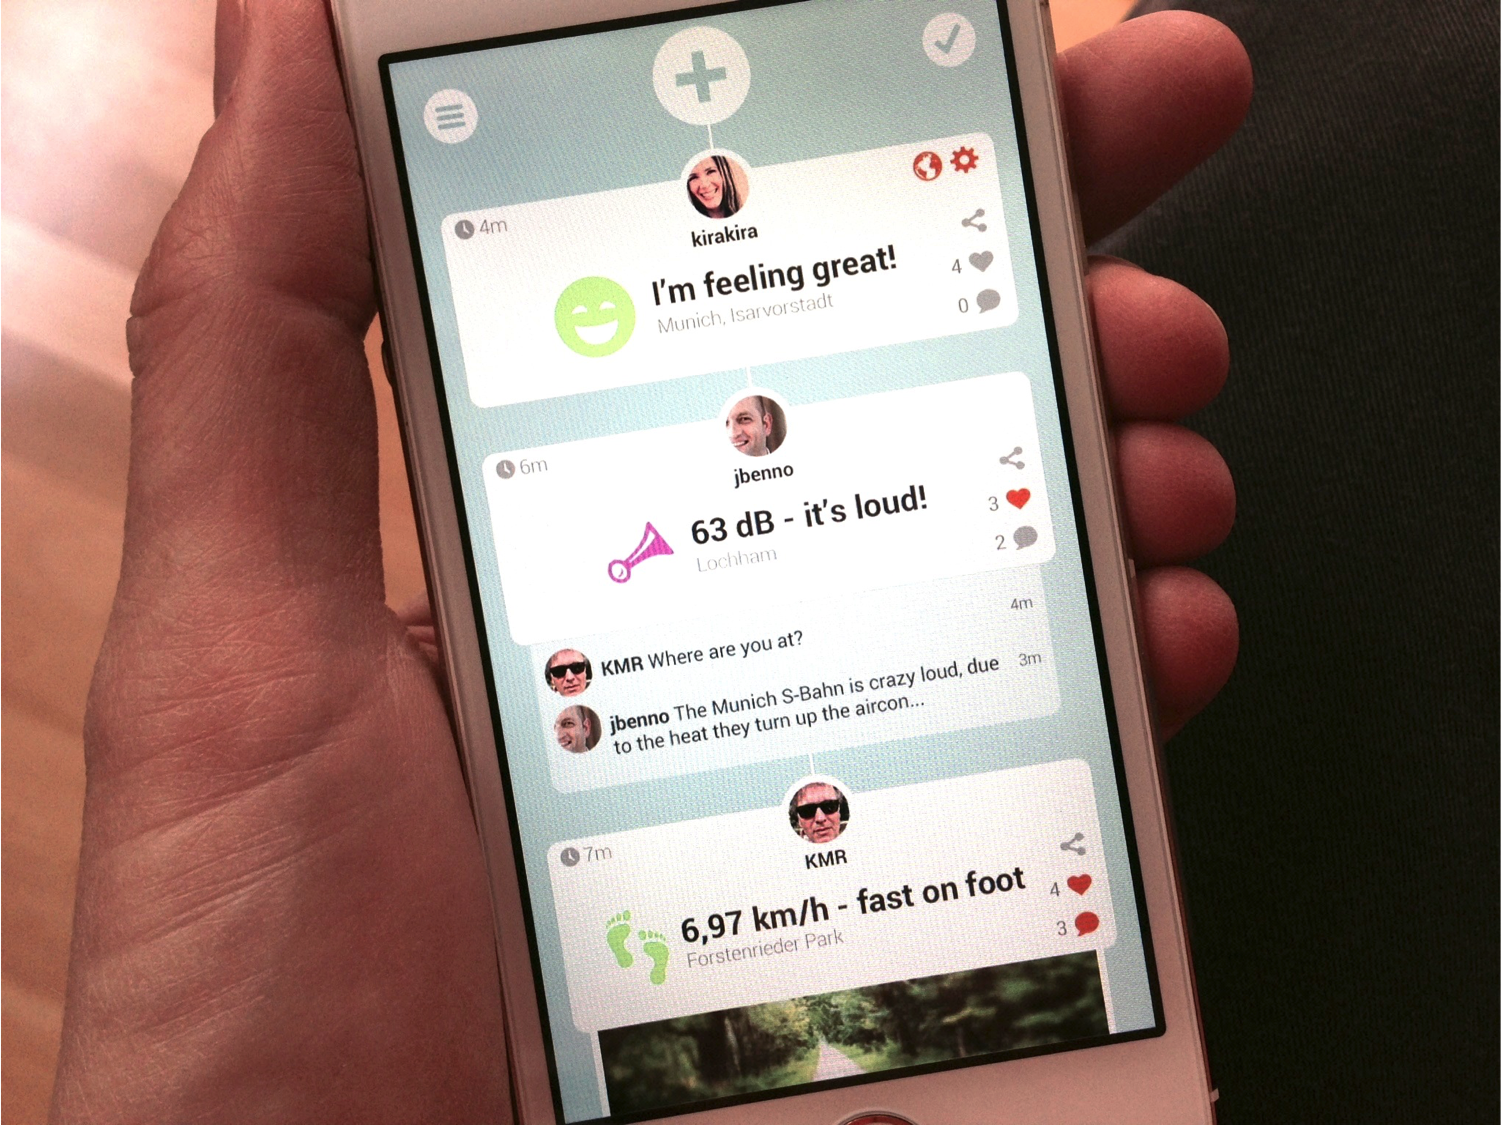
The Data Timeline is an app-centric timeline of your own behavior data and that of your social network. Using the Data Timeline is like looking into a mirror: you see yourself – not your external appearance but the visualization of your body data, you see the most complete picture of your Self. he Data Timeline presents your data in a contextualized way: you see the data and its meaning in individual contexts – your personal data moments.
Reason Why
Each day, an individual produces about 20MB of smartphone data. This data can be of vital relevance for her: it can save her life. Or it can help her optimize her life. Or the life of her friends. In order to make meaning of this data, the user needs her own individual data timeline, she needs to see her data, in its contexts and visualized in a comprehensible way.
You and your friends
And it’s not only your Self – but you see real time snapshots of your friends, too! You know about their well-being, their movements or the noise levels they are exposed to. So you already know that your significant other is quite exhausted before she returns from work and you could prepare a candlelight dinner for her. You can share snapshots of your Self with your friends right away from the Data Timeline using the integrated Twitter, Facebook et al. sharing options. You decide with whom you want to share your data.
Own your body’s data
You should own your body’s data – because your data can reveal much more than even your doctors know. Your data is a very important part of you. You can use the Data Timeline to get the meaning of your data and – if you are a geek – you might even download all your raw data, dive into it and analyze it with your own tools. You have full ownership, full transparency and full visibility of your data.
The Data Timeline essentially is a platform matching users with Quantified Self services. It comes as in the user-centric format of an app timeline displaying the user’s individual behavior data and that of her social network. It shows an individual’s body and environmental data in its specific contexts. Passively tracked data are complemented with interaction data, such as status updates, comments and answered surveys.
The Data Timeline provides the user with her data itself and – via its API – the Data Timeline matches the user’s individual needs based on her data with respective Quantified Self services in the areas of health, fitness & well-being, travel & tourism as well as finance.
The Data Timeline’s technology is based on open source software, but all algorithms, especially for the Complex Event Processing Engine, are fully owned by Datarella. All raw personal data of individuals is owned by its respective users, according to German law. However, all aggregated data, all visualizations, and all analysis based on that data is owned by Datarella.
