We have been trialing our app explore in the field since the beginning of December together with our partner Serviceplan Group. Employees of the different branches of Serviceplan tested explore regarding stability and usability. After four weeks testing we can happily announce: explore has passed the test with excellence. The app runs smoothly and stable and will be used in the wild from January on.
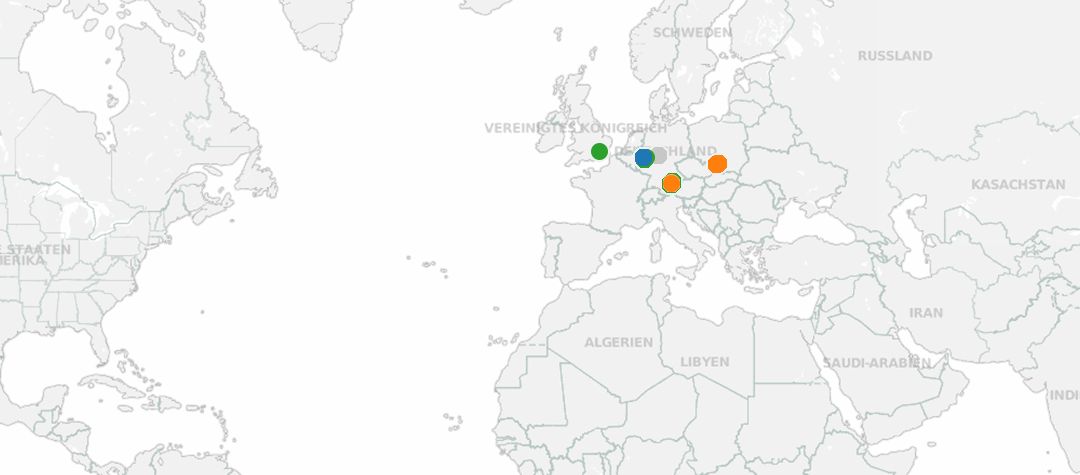
Main user locations explore app, December 2013 (Source: Datarella)
The app users have been mostly situated in Germany, but explore was in use also in London, in Poland, Thailand and at the US West Coast, as you can see on the figure above. In an impressive way the aggregated paths and whereabouts map the main routes of the local transit services within Munich, including the lines to the airport, and also the most frequented areas in Munich city, Schwabing, Isarvorstand, and Sendling, and the south west:
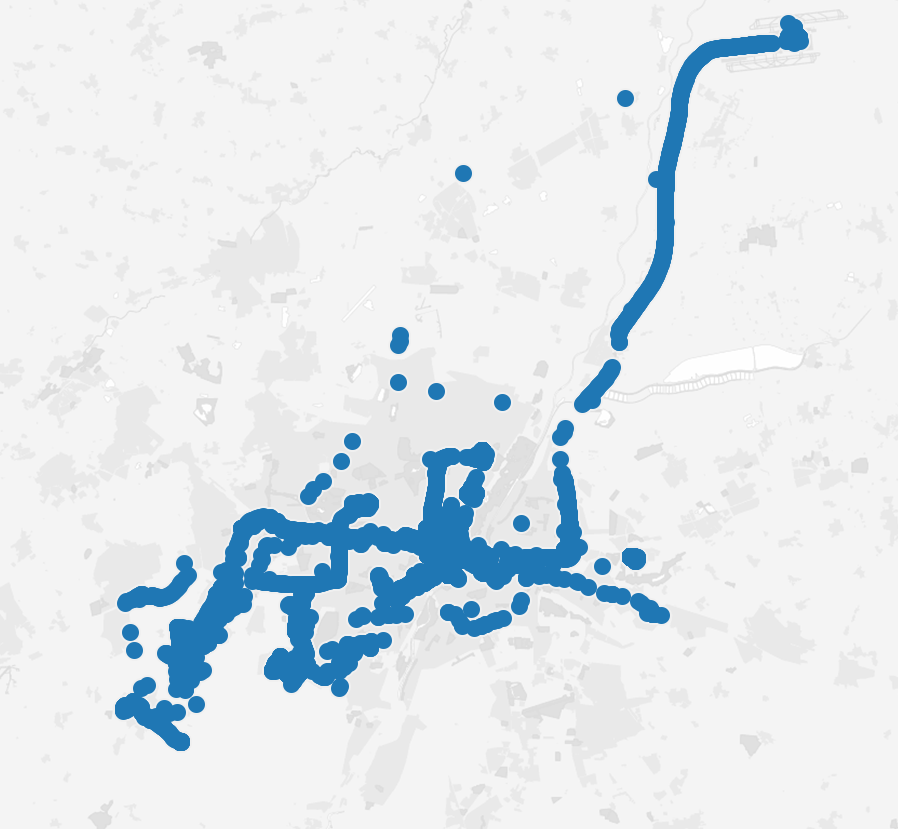
Main user locations within Greater Munich, explore app, December 2013 (Source: Datarella)
All explore participants have been keeping on using the GPS functionality over the full span of the trial – no one has chosen the option to switch off the tracking, which can be done in the settings of the app. This is an important result of the trial: the feature to opt-out was notified to the users, but no one has actively quit the tracking. For the Datarella team this indicates clearly that GPS-tracing is generally accepted by the user, at least if she recognizes, she would get something back from it.
Apart from being able to map the individual paths, the GPS-tracking was deployed to ask the users questions about the specific places they passed by and about the corresponding time. Thus we could learn why a user would stay at the train station and what she would have done there apart from getting on a train.
Additional to the location specific questionnaires, we issued up to three surveys per day, each with up to 10 questions. These surveys covered the different parts of life: the job of course (it was not at last a trial with employees of a company), but also regarding leisure and other topics like general well being, media consumption, environmental concerns, and much more. To find an optimal compromise between the app’s usability and the operational feasibility of the results was one of the main task of the trial.
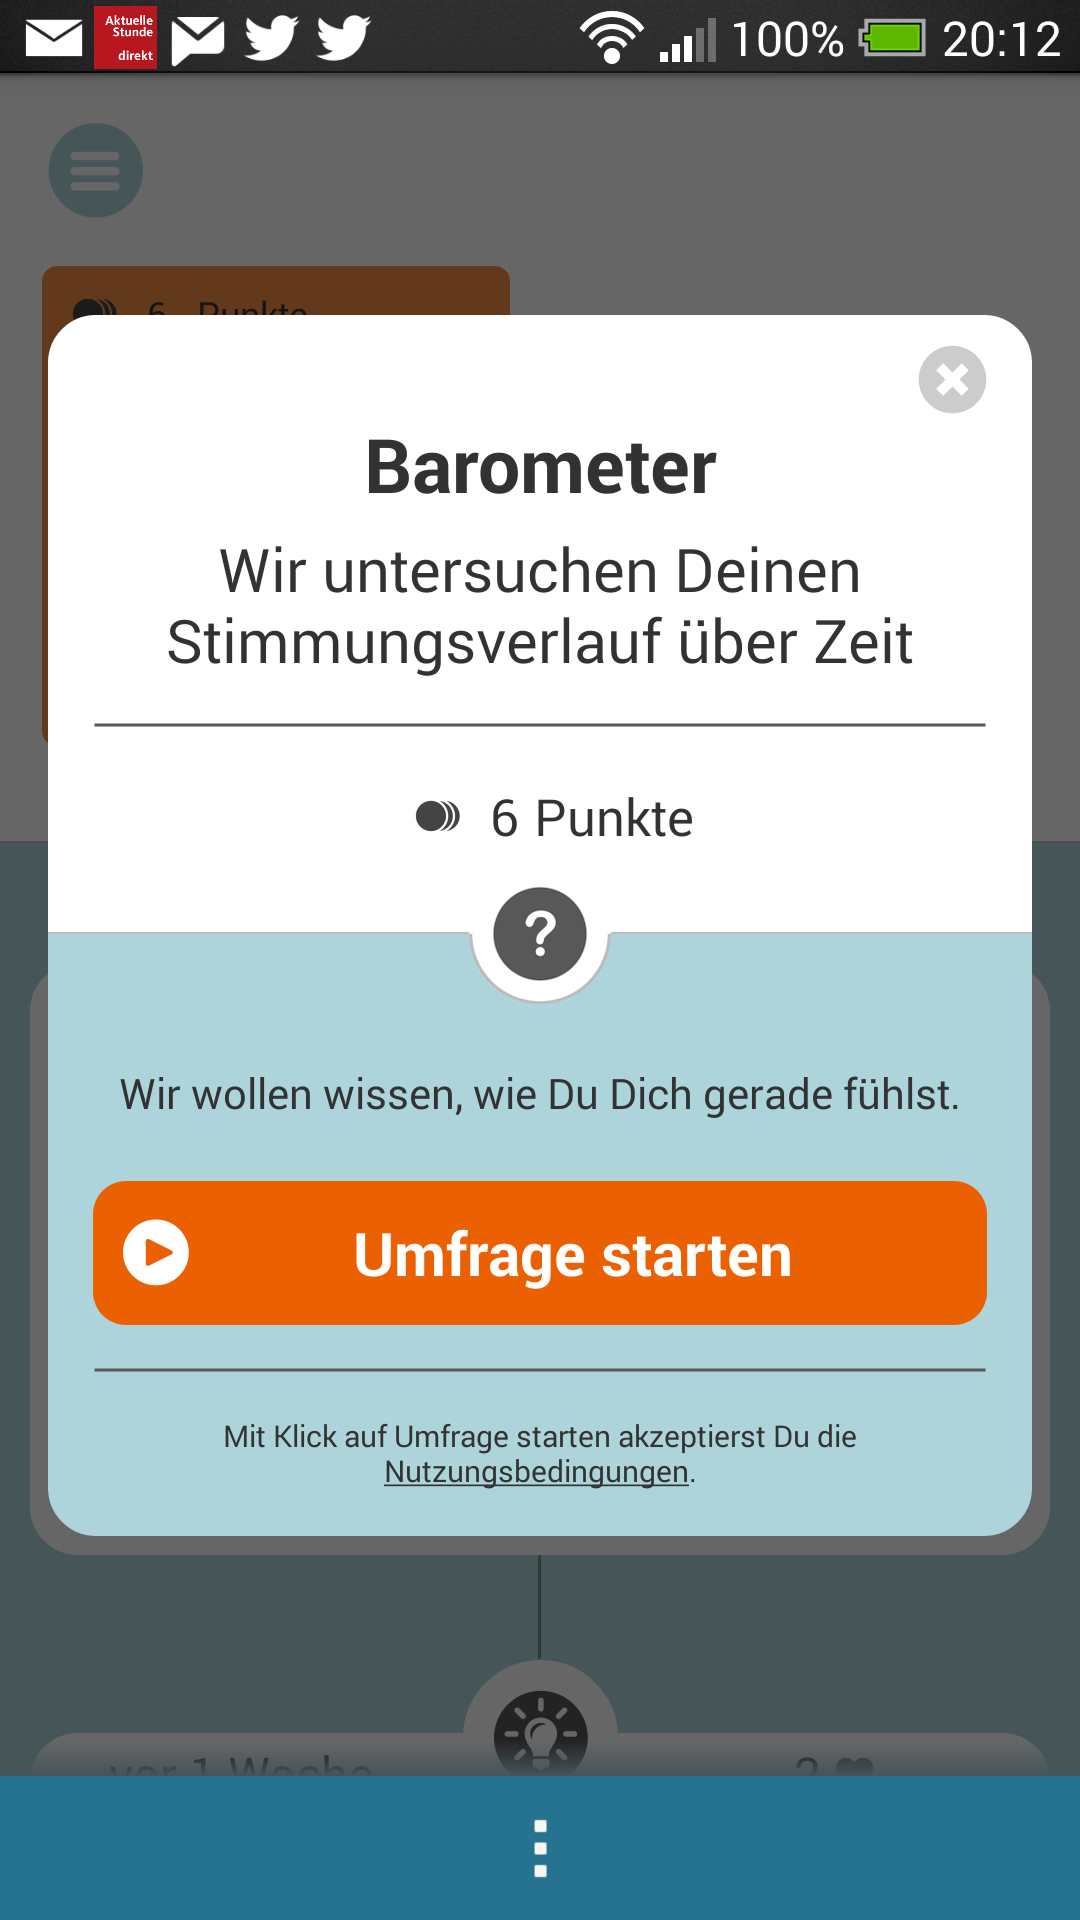
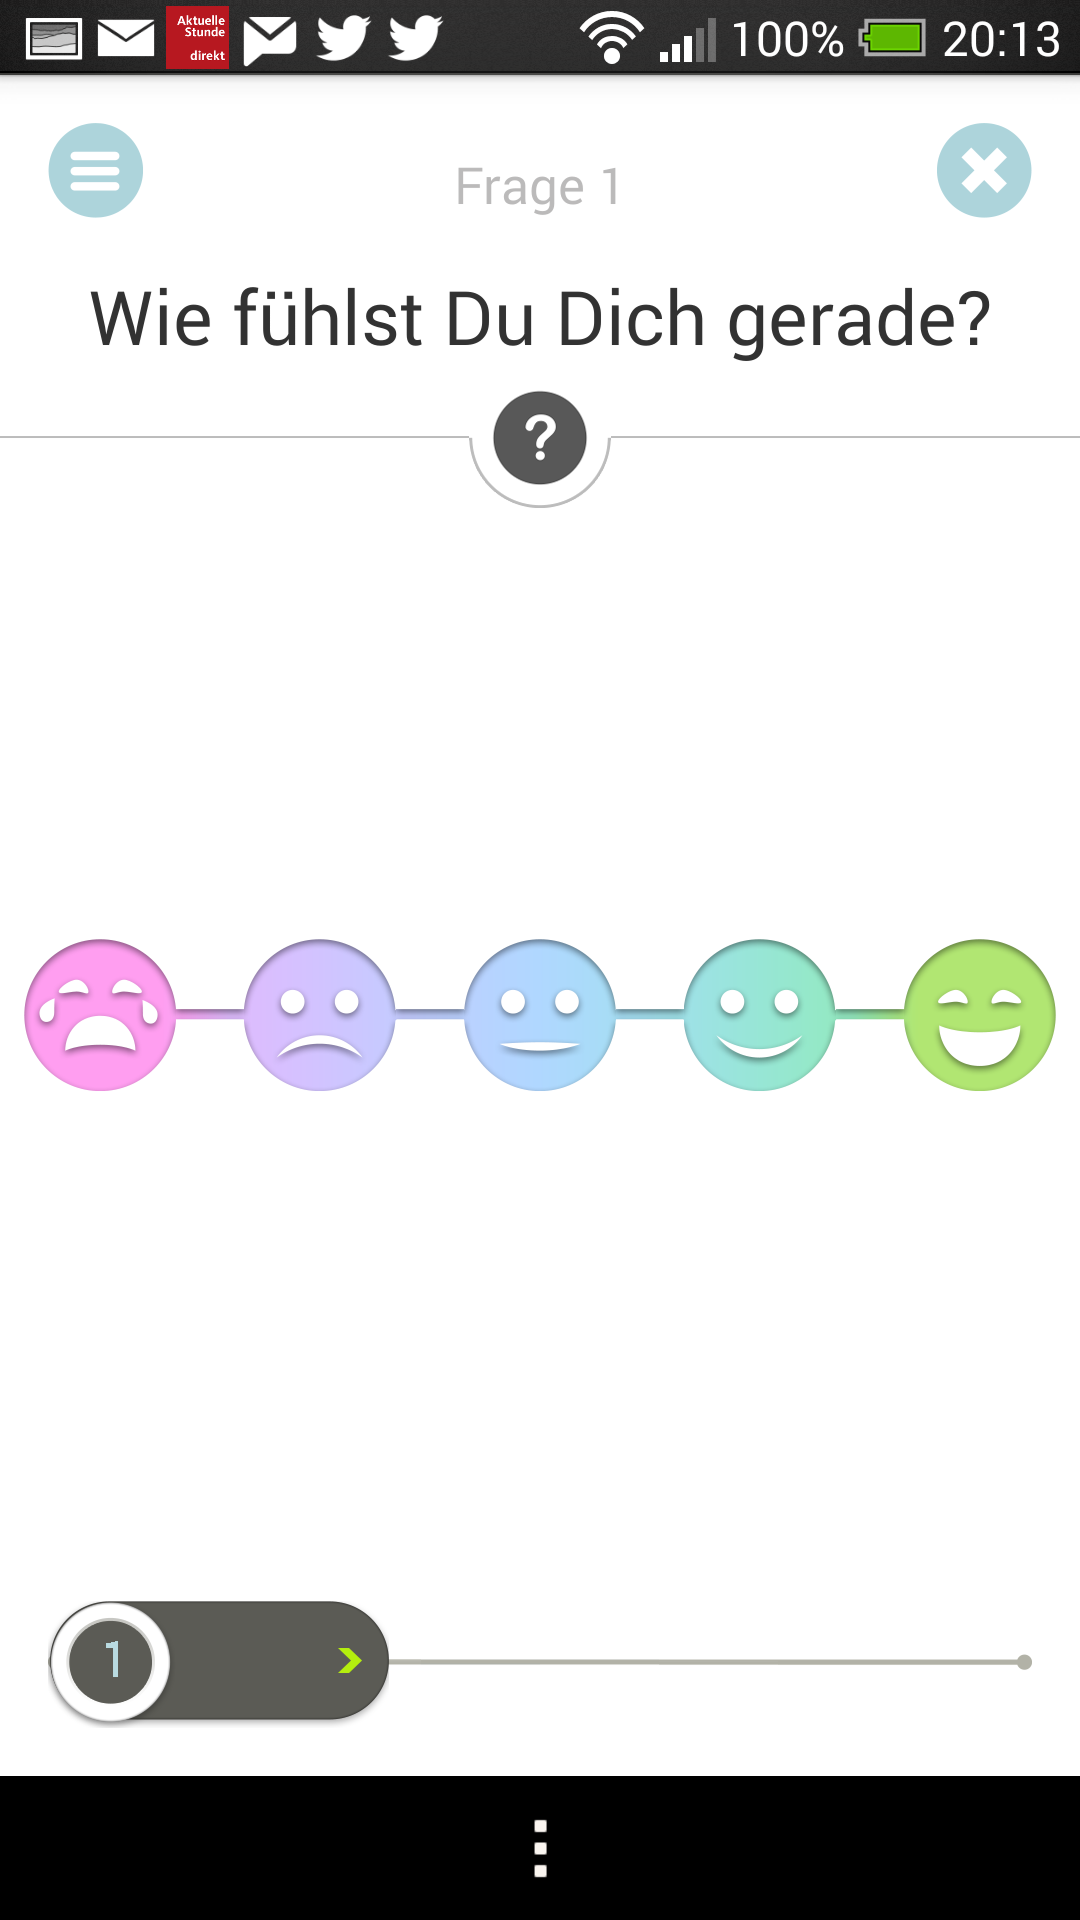
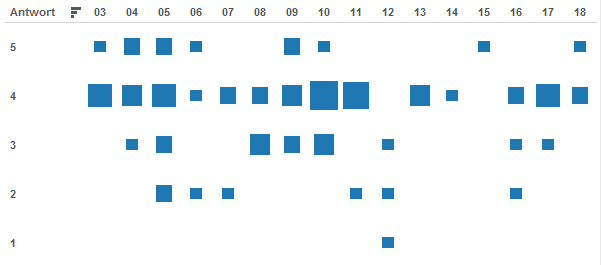
Survey: “How are you?”, explore App, format: Smileys 1=very bad, 5=very good (Source: Datarella)
This figure gives the format of the survey (as shown within the explore app) and how the responses could be analyzed (in our backend), for the example “How are you?” (“Wie fühlst du dich?”) from December 3rd to 18th. This question is part of the “mood barometer” survey which can be answered by the user on a scale of five smileys. In the analysis, the weeping face corresponds to a value of 1, the beaming smiley to 5. This survey is presentet repeatedly and thus makes the mood trend visible over time.
Survey: “How are you?”, explore App, format: Smileys 1=very bad, 5=very good (Source: Datarella)
This shall give only a small excerpt of the results of the explore field trial. We find it just awesome that the results have been so positive and we now deploy the app with a much broader circle of users. This will be announced early in January with another blog post. If you want to participate, just contact us. The app can be downloaded from Google Play.
We want to thank all participants of the field trial and look forward to continue with an enlarged user base. To all our readers we wish a good start for 2014!