by Kira Nezu | 2 May 2014 | Blockchain

Tracking your life can mean any form of recording: some body measures like weight, your workout, your food intake, your sleep patterns – this is the “classic” Quantified Self. One of the most intrusive, yet intriguing ways of tracking your life, however is actually track it visually. Lifelogging, taking visual record of your life, has been popularized to some extent by Steve Mann. Mann became notorious for getting thrown out of a McDonalds in France for wearing his head mounted camera.
I have started to experiment with life logging myself. I use the Narrative Clip, a gadget of approximately 5cm diameter that you clip to your clothes and that automatically shoots a picture every 30 seconds.
While wearing the clip, I made several observations: although I quickly stopped thinking about my carrying the camera continuously with me, I realized that I started to adjust my behavior. I would sit more upright, eat and drink very cautiously, even turn my field of vision in a direction, I would expect to look more interesting on the images. People that I encountered in the public were obviously not aware of my surveillance, even though my clip is bright orange in color.
I have put together some random ranges of my day. Our culture is frankly not ready yet, to have bathroom-time shared, so I start with an image I take as rather unsuspicious: brushing my teeth and preparing to leave the house. After my cycling through the neighborhood to run some errand, you see my drinking tee, leaving for our office by the local communter train, where I met my friend Dr. Koehler (quite nicely portraited). After leaving the train, you see my walking from the station to our office. I close with a serries of our board meeting (where you see my collegue Kira sitting on the opposite side of the table).
[Tune in and watch our Datarella People interview with narrative engineer Dan Berglund]
[Note: I am going to write something about the inherent problem of gender culture and abelism that I feel going with self-tracking like this]
by Kira Nezu | 29 April 2014 | Blockchain
In this post, I will make some predictions on the nearer and farther end of the Quantified Self movement. Using McLuhan’s Tetrad, I will argue that Quantified Self will get huge incentives from enhancing healthcare, crowdsourcing science, and support a strong common ground, people will organize their life upon. Also, Quantified Self will weaken institutionalized medical care, and it might even obsolesce governmental surveillance by pushing moral control from institutions back to communities. By this, Quantified Self retrieves a form of communal life that could be called a bucolic, but also global village. Finally, Quantified Self, together with the web and social media, can become part of an adaptive, global operational system that make a population of 10 billion people sustainable.
Organizing a System of 10 Billion People
Quantified Self – this means tracking your life, analyzing the data, sharing intimate details, and changing behaviour. Self-tracking has become a huge thing recently. It is a complex built on three rather new technological pillars: wearable technology, hardware to measure your life, sensors that everyone can carry around, second ubiquitous mobile technology, thus the means to emit the data at once into the cloud, and finally social media everyone participates in and by which everyone is connected to everyone else.
The third column, social networks, has already laid the ground for people to accept, their lives becoming more transparent to others, to keep track on many things, like their friends and interconnections, their daily routine like food which they take images of and share, and also the special events, the highlights, that are in particular shared.
So, tracking your life and sharing it with others has become a rather common thing. Quantified Self now ads measured data to that. Be it your work-out, your running, cycling or other sports activities, be it dietary data, or be it data about chronically conditions, your blood pressure, your muscular tremor or even your mood.
Quantified Self already supports the lives of people suffering from bipolar distortion, from Parkinson disease, cardio-vasculary disorders and many other objectives that would usually demand a much higher attention from medical doctors than anybody can afford or would like to maintain because of its time consumption.
What does Quantified Self enhance?
From healthcare to selfcare
To keep people healthy, more self-determined even under chronic conditions, is a huge, immediate benefit of Quantified Self. By providing cheep analytics like test strips for all kinds of metabolic blood tests, easily ordered via Amazon, Quantified Self brings medical support to people living in regions without hospitals nearby or without standard public healthcare systems.
This benefit is strong. It alone will promote Quantified Self to a huge extent. When a society realizes how much efficiency is gained by citizens tracking their vital data, there will also be monetary incentives for doing it. This might start with getting tax breaks or deductibility, and go on with discounts on health or life insurances.
Crowdsourcing science
Quantified Self does not only support the self-trackers themselves. It is also collects data on many individuals. Self-tracking does not only include tracking health. People track their whereabouts, their financials, and – often without being aware of – all kinds of other data tracked by their smartphones automatically and continuously. Thus, Quantified Self is in fact a huge collection of different experiments on social behavior, mobility, health, life conditions – on a large scale. Some experiments are literally crowdsourcing the data collection to the self-trackers.
The benefit of having this data available is huge. Doctors’ records are only showing a small portion of people’s life. Quantified Self can draw a much more complete picture. Huge advances in early diagnosing illnesses and finding cures for individuals will be possible.
A common ground
Sharing personal data via Quantified Self also works as an extension of sharing thoughts, opinions, and events via social networks. You connect with others by sharing your life, and particularly by exchanging with others, getting back from them what you gave before. Sharing creates bonds that wave the social fabric denser. We realize what is relevant to others, what is the matter with them, and we can show respect for their condition.
What does Quantified Self make obsolete?
Disrupting medical care
Bringing your own medical data to the doctor will certainly not only create joyful reactions. Self-tracking is the first step of becoming more independent from experts. Whenever people started to massively share things, two developments occurred: crowdsourcing became more and more efficient and effective, and the proprietary hubs decayed. We will see this happen. Most likely, it begins at the periphery. First, the classic practitioners will feel decreasing numbers of visitors. The small laboratories will see falling numbers in prescribed analyses. Maintaining a small medical shop will become less and less profitable.
People will also become more demanding. The passive that is the etymological root of patient will change into active, educated, knowing, and no longer taking the expert for granted. People will start to question the solidarity of health insurances. Why would they still pay for others who willingly and consciously bring their health at risk? Of course they would demand discounts, making risky behavior even more expensive. In the end, with most medical support at hand, provided by advanced self-tracking analytics and the crowd, people would not only have become autonomous, but also autarkic.
Surveillance becomes pointless
The spook business might get in trouble with Quantified Self, too. This sounds contradictory at first: didn’t the NSA turn Facebook, Google, and the whole web into a giant surveillance machine? Surveillance is characterized by entities watching many “objects”, which often are not even aware of being watched. This is what the prefix “sur” means: from above. The end point of surveillance is the panoptikon as envisioned by Jeremy Benthem in the 18th century: a society confined within a circular prison that surrounds a central watchtower. Very few guards are needed to contain a panoptic prison.
With every step in life becoming tracked and stored, it will be increasingly difficult for authoritarian security forces to conduct their atrocities that keep people small. We already witness police violence all over the world, documented and published at once, via smartphone. Surveillance turns into souvaillance, watching back. Without the hierarchical gradient, surveillance as means of suppression becomes pointless. If it is just evidence for wrongdoing that is needed, people voluntarily will provide that with their own gadgets.
What does come back from the past through Quantified Self?
The Global Village
The all-seeing panoptic eye of governmental control will vanish. What comes instead is your neighbors being able to see into most of you and your life. Society will degrade to community. As people start to question insurances and ask to bring their own wellbehaving into calculation, people will also start to question anti-communal behavior as a whole. Instead of showing off with prestigious wealth, locking yourself behind gated communities, keeping “the 99%” outside, provoking aspiration, people will start to pose as meaningful members of the community.
People will care. Everyone becomes their neighbors’ keeper. Help is always near, as is judgement. This of course bears some serious problems: while some behavior in public is broadly accepted for men, the same might be taboo for women. Narrow communities are usually not too tolerant against those deviating from what is regarded as “normal”. We will have to fight unprecedented forms of ableism – the movie GATTACA might serve as a good illustration.
No longer being on your own means becoming embedded into a lively community with all its warmth and kindness, and at the same time, coming under the full power of moral control. Individual deviance might get strictly sanctioned. Although deeply liberal by empowering the personal self, the quantified society will enforce communal morale. A bucolic global village with communitarian moral control might not sound like fun. However, compared with authoritarian security regimes most of humanity has to live with nowadays, is far worse. Quantified Self guides people to act responsibly for themselves as well as for others. In the end, we might gain more freedom than we give up.
What does Quantified Self finally flip into?
Stabilizing the global society
Quantified Self as extended social media weaves a smooth tissue of social fabric between people on a global scale. The emergent communal control warrants sustainable behavior like no legal system ever could. By building a communitarian, voluntaristic moral society of all humanity, Quantified Self might be a step towards a global social operating system.
System theory (although I am not really fond of it, I must admit) gives a good explanation, why global movements like social media and Quantified Self have occurred just now and why both will not be temporary but will accompany us for a long time.
When the global population started exploding at the beginning of the 20th century, major disturbances took place even threatening the further existence of the whole system – mankind: the world wars, atomic warfare, destruction of the environment, climate crisis, and huge economic inequality, to name a few. However, systems tend to stabilize. I believe that the web, social media, open data, and Quantified Self may let the system regain stability under the changed condition of a population unmet in size and density.
The noo-sphere
With social media, we already feel permanently connected to our community. With self tracking, we will be aware of our peers even more seamlessly. First, we will be connected with others cognitively and emotionally, but with wearable technology this connection even turns physical. Also, we will become aware of all the data that surrounds us. Data will look like extra dimensions invisible for the unarmed eye, but meaningful and rich for our head-up displays and also getting directly knit into our lives by interacting with our health and wellbeing. We already experience the world getting augmented by the data-sphere. But this experience of specialness will vanish. Data will become integral with our sensory, biological self. And, as we get more and more connected, our feeling of being tied into one body will also fade, as we become data creatures, bodiless, angelized.
Note on McLuhan’s Tetrad
McLuhan’s Tetrad: a framework to foresee effects of changes of media and technology on culture and society in different dimensions.
Enhances
Health, Fitness, Science, Communication |
|
Retrieves
Temperance, Communal Life, Caring, Bucolic Village, Moral Control |
|
Quantified Self |
|
Reverses into
Organizing a System of 10 Billion, Noo-Sphere, Angelization, Weltgeist |
|
Obsolesces
General Practioners, The Psychiatrist’s Couch, Surveillance |
by Kira Nezu | 3 April 2014 | Blockchain
Many parameters a smartphone accidentially measures are useful in monitoring the environment. We have recently discussed, how air pollution with particulate dust can be monitored with an easy ad on to the phone’s camera. But there are even more subtle ways by which users can help to research and monitor environmental conditions.
Another example is given by A. Overeem et.al. who track urban temperature over time in various metropole regions arround the globe. The approach is as simple as powerful: a regression over the battery temperature (that is measured by every smartphone anyway).
The microphone, too, can give valuable data on local environmental conditions for an unlimited mass of individual users that participate. Sound level show noise emmission that can be located in space and time. Noise is regarded as a prime source of stress, but rather little is known about the changes that occur in different microgeographic regions.
Apps like Weather Signal use thus a combination of the phone’s sensors to contribute to a richer model for weather conditions.
Appart from just passivly deploying the phones as sensor boards themselves, it is of course also possible to collect data from other local sources and just transmit the results via smartphone. This can be done by letting the users take a picture of some reading of a scale which can then be processed via image recognition. Or you just ask people to put in the readings or their observations into some kind of questionnaire.
The fascinating thing is: since so many people in almost every country carry a smartphone, monitoring environmental conditions and changes is now possible on far larger scales than ever before.

by Kira Nezu | 26 March 2014 | Blockchain

Smartphones carry versatile sensors. With appropriate apps, expensive instruments can be very well replaces – even sometimes the Geiger counter.
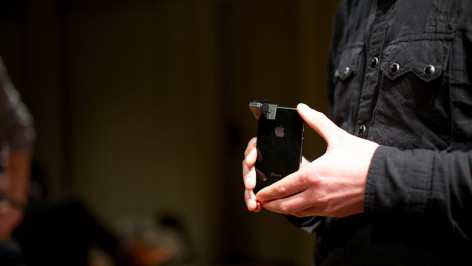
Gamma rays which are often products of radioactive decay, are also electromagnetic waves, just like light, however much more energetic. That means: as radioactive radiation can expose a chemical photographic film, it can as well effect the camera chip in the smartphone.
A team of researchers at the Idaho National Laboratory in Idaho Falls have used this property to change common smartphones into detectors for radioactive radiation. The radiation is recorded via the camera an an app, which calculates the radiation intensity from the data collected.
With this approach we learn again, how versatile mobile devices can be deployed. Up to thirty sensors in each smartphone measrure all kinds of variables like temperature, magnetism, brightness, sound and many more. With a little creativity we can combine these measurements and get valuable data about the environment around the smartphone and its user, that not rarely can replace expensive, specialized methods.
Here the link to the original publication:
Joshua J. Cogliati, Kurt W. Derr, Jayson Wharton: Using CMOS Sensors in a Cellphone for Gamma Detection and Classification
by Kira Nezu | 31 December 2013 | Blockchain
We have been trialing our app explore in the field since the beginning of December together with our partner Serviceplan Group. Employees of the different branches of Serviceplan tested explore regarding stability and usability. After four weeks testing we can happily announce: explore has passed the test with excellence. The app runs smoothly and stable and will be used in the wild from January on.
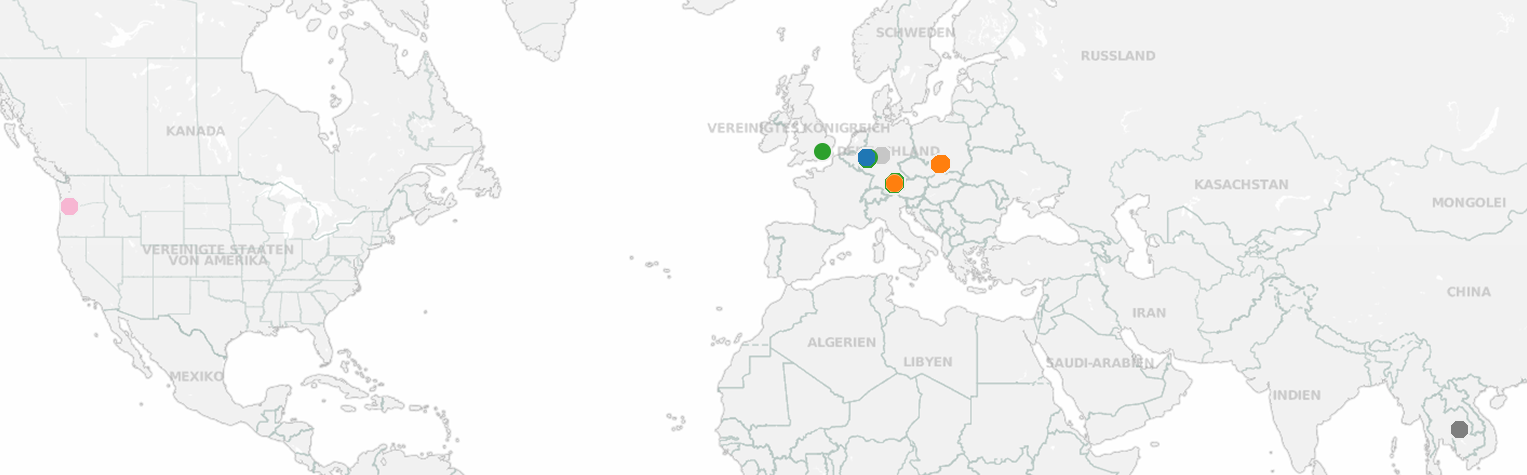
Main user locations explore app, December 2013 (Source: Datarella)
The app users have been mostly situated in Germany, but explore was in use also in London, in Poland, Thailand and at the US West Coast, as you can see on the figure above. In an impressive way the aggregated paths and whereabouts map the main routes of the local transit services within Munich, including the lines to the airport, and also the most frequented areas in Munich city, Schwabing, Isarvorstand, and Sendling, and the south west:
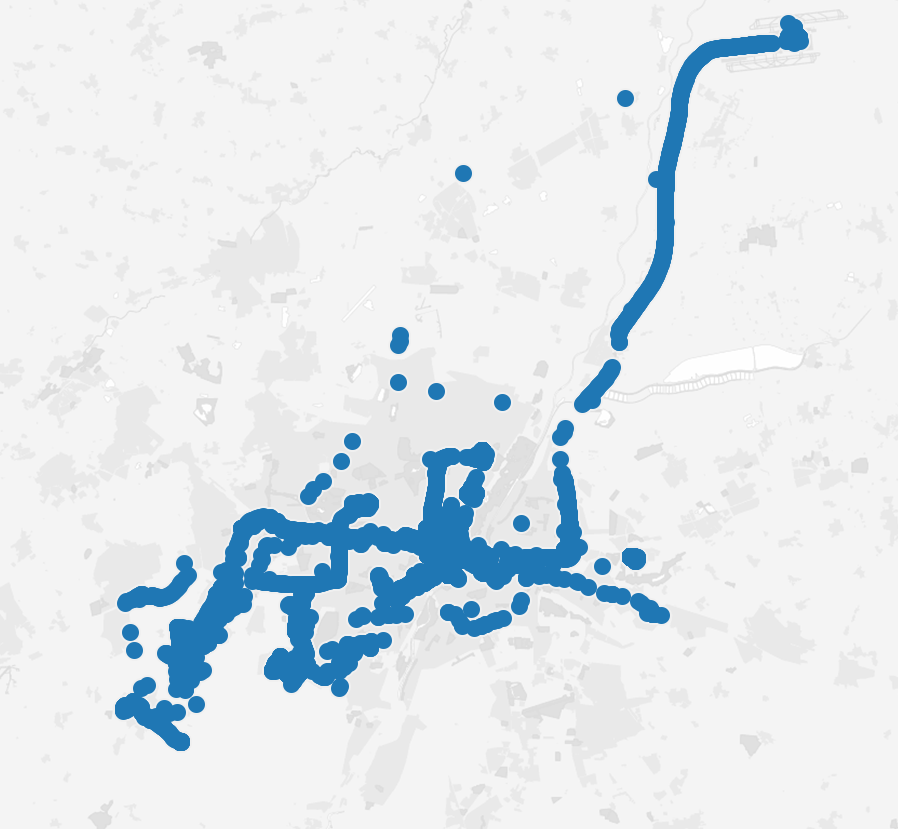
Main user locations within Greater Munich, explore app, December 2013 (Source: Datarella)
All explore participants have been keeping on using the GPS functionality over the full span of the trial – no one has chosen the option to switch off the tracking, which can be done in the settings of the app. This is an important result of the trial: the feature to opt-out was notified to the users, but no one has actively quit the tracking. For the Datarella team this indicates clearly that GPS-tracing is generally accepted by the user, at least if she recognizes, she would get something back from it.
Apart from being able to map the individual paths, the GPS-tracking was deployed to ask the users questions about the specific places they passed by and about the corresponding time. Thus we could learn why a user would stay at the train station and what she would have done there apart from getting on a train.
Additional to the location specific questionnaires, we issued up to three surveys per day, each with up to 10 questions. These surveys covered the different parts of life: the job of course (it was not at last a trial with employees of a company), but also regarding leisure and other topics like general well being, media consumption, environmental concerns, and much more. To find an optimal compromise between the app’s usability and the operational feasibility of the results was one of the main task of the trial.
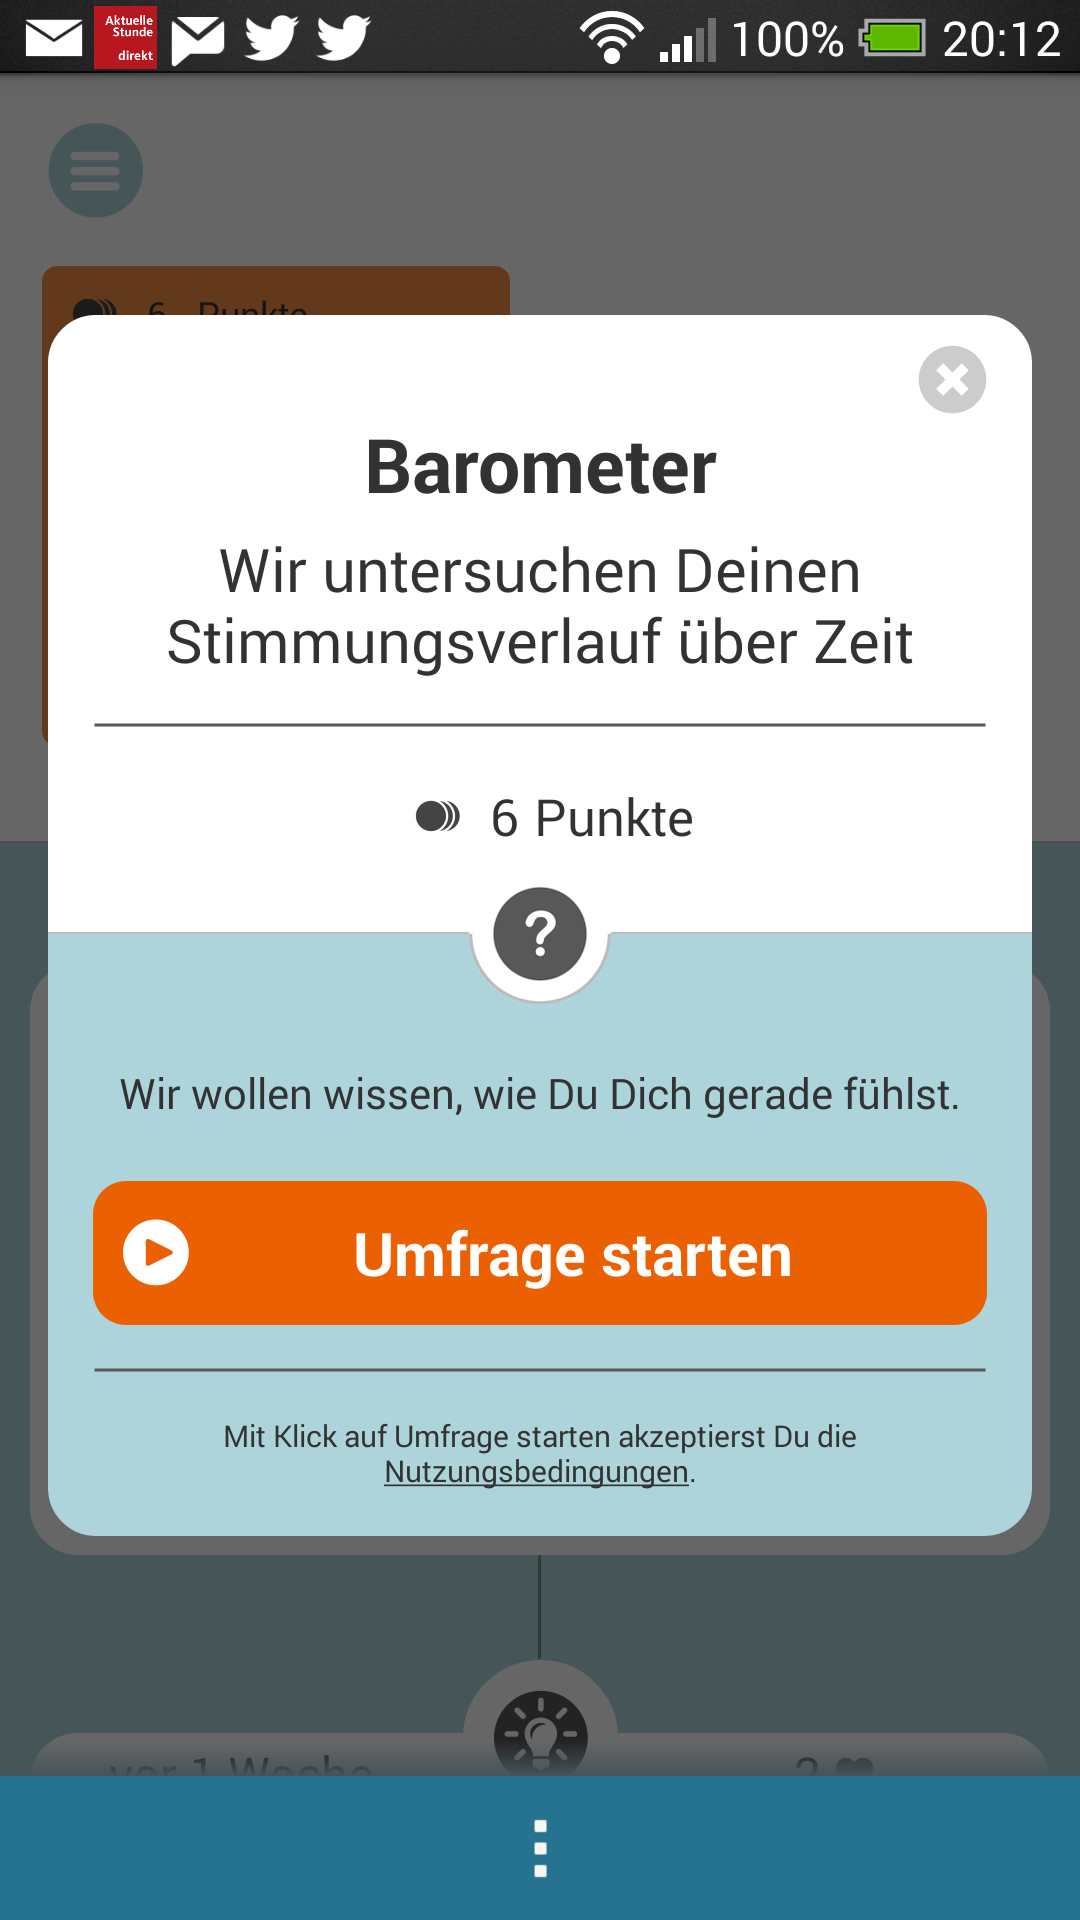
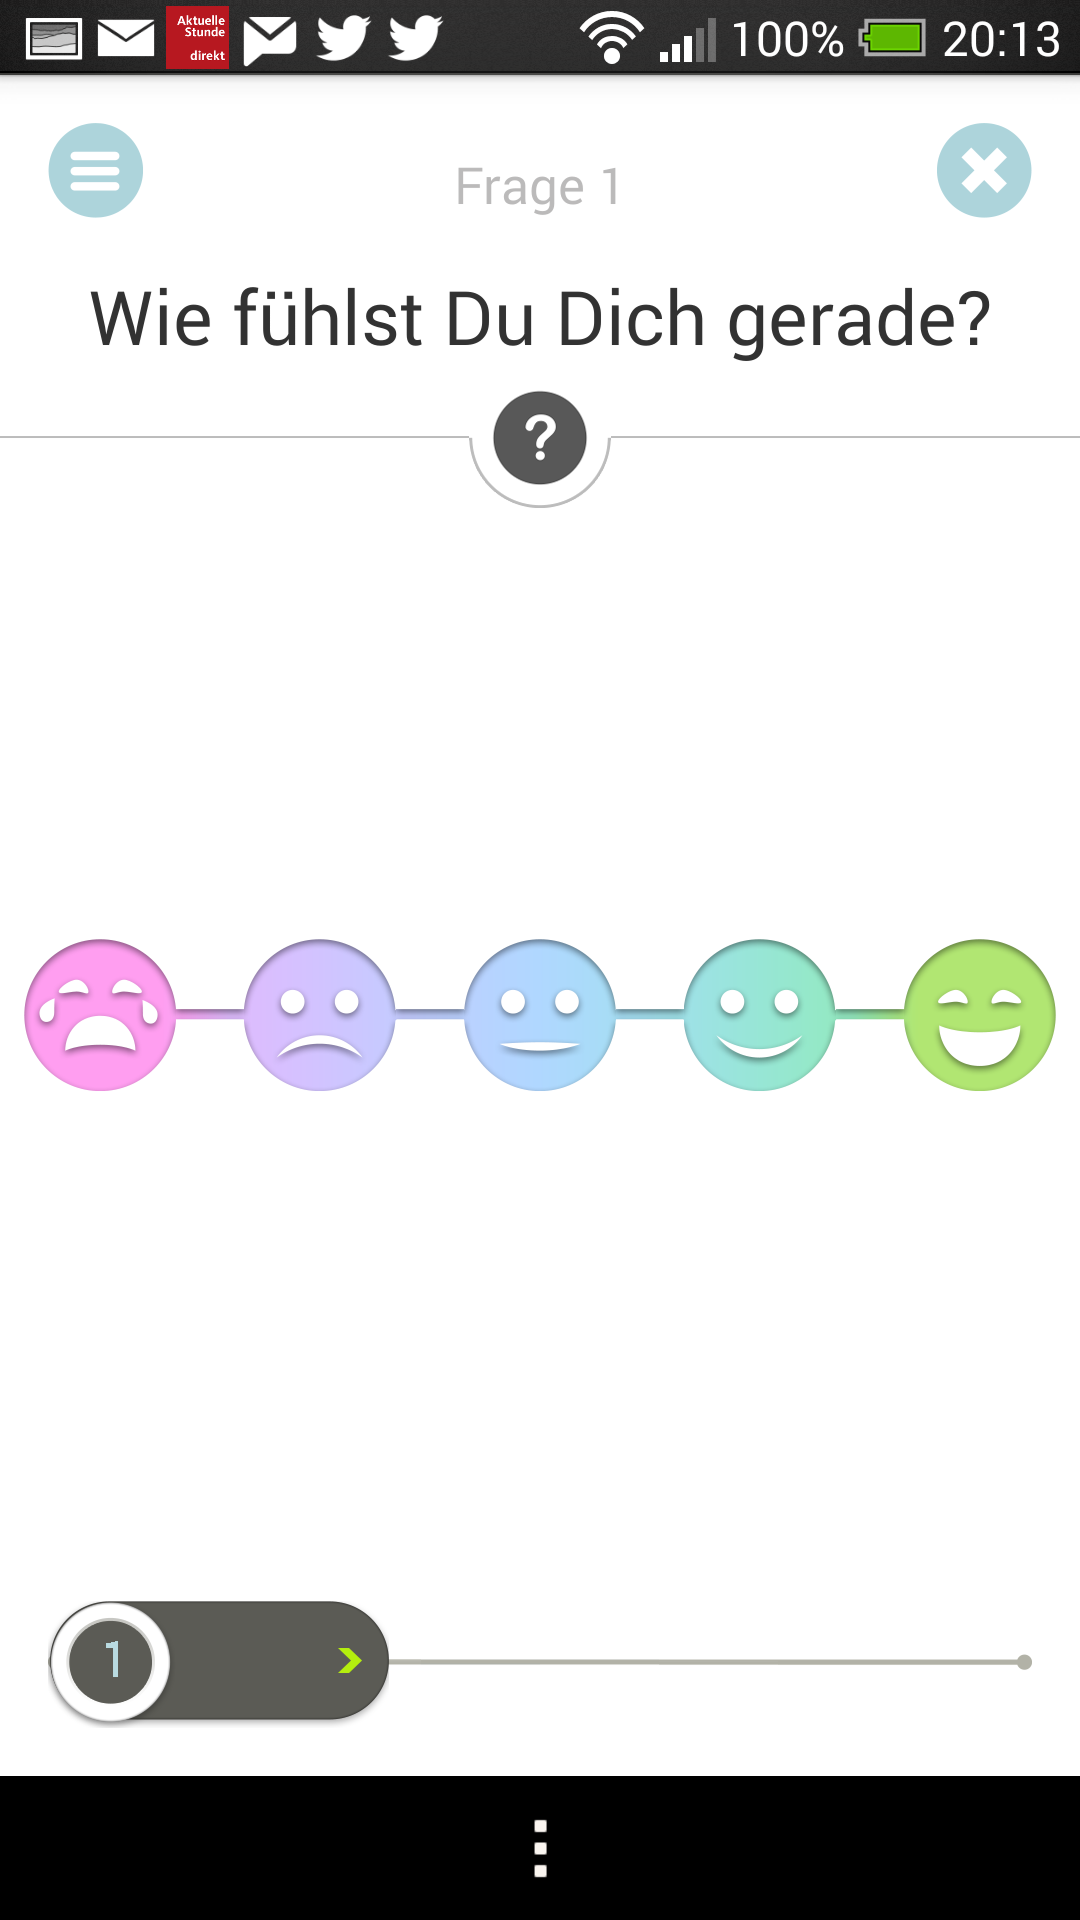
Survey: “How are you?”, explore App, format: Smileys 1=very bad, 5=very good (Source: Datarella)
This figure gives the format of the survey (as shown within the explore app) and how the responses could be analyzed (in our backend), for the example “How are you?” (“Wie fühlst du dich?”) from December 3rd to 18th. This question is part of the “mood barometer” survey which can be answered by the user on a scale of five smileys. In the analysis, the weeping face corresponds to a value of 1, the beaming smiley to 5. This survey is presentet repeatedly and thus makes the mood trend visible over time.
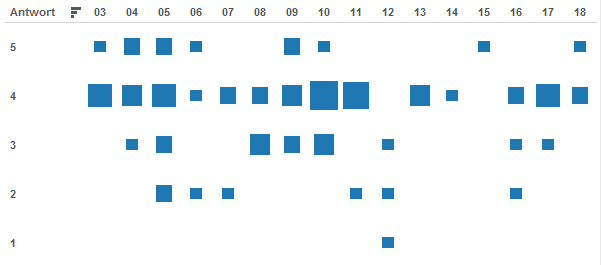
Survey: “How are you?”, explore App, format: Smileys 1=very bad, 5=very good (Source: Datarella)
This shall give only a small excerpt of the results of the explore field trial. We find it just awesome that the results have been so positive and we now deploy the app with a much broader circle of users. This will be announced early in January with another blog post. If you want to participate, just contact us. The app can be downloaded from Google Play.
We want to thank all participants of the field trial and look forward to continue with an enlarged user base. To all our readers we wish a good start for 2014!