by Michael Reuter | 7 April 2014 | Blockchain
About 0.5% of big data collected is actually being analyzed and monetized. The “rest” ends up unused. 90% of all data ever created has been generated in the years 2012-2013, and 30% of it contains valuable information. During the last years, the amount of data has been increasing exponentially. Enterprises around the world are beginning to put Big Data on the top list of their operations.
Big Data comes with a paradigm shift not only in research: here, the industry is shifting from finding and asking the right questions to letting the data speak for themselves, enabled by smart algorithms doing their analysis automatically. In marketing, the same paradigm shift is taking place: CMOs are provided with factbased, individualized answers in realtime, rather than with intuitive, retroactive perspectives of traditional market research.
While it’s not the data in Big Data which is important. Rather, it’s the insights derived from it, the quality of decisions you make and the actions you take that transform big data into smart data, or “affinity data”, if you drill the data funnel down to the individual: the more information marketers have on their user’s likes, preferences and interests, the better they can target the individual with content personalized to her interests. This is helping companies generate insights into their customer bases, and thus create new and better targeted products and services.
There are twice as many “things” connected to each other on the internet than people. By 2020, this number will rise to 50 billion connected devices. Devices connected with themselves and people – this gigantic communication network will provide unprecedented insights into human behavior. From customer segments to the individual customer, from retroactive long-term research to realtime knowledge – the new status quo of data amounts to enormous opportunities on the one hand and crystal clear obligations on the other: enterprises that do not understand the implications of big data will lose traction against their smarter competitors who have built up vitally needed expertise in big data analytics.
Over the next weeks we will describe how big data can make a substantial impact in customer engagement, customer loyalty and the overall marketing performance. We will start with the airport industry which, beside its aviation business, heavily relies on the non-aviation business, such as shopping malls.

by Michael Reuter | 4 April 2014 | Blockchain
Life logging, tracking, the Quantified Self, the Quantified Life – and now the Quantified Us? Do we need more or better expressions for this global trend which motivates people to change their behavior?
Matthew Jordan and Nikki Pfarr from Artefact make their case for changing the Quantified Self into Quantified Us. The first degree of meaning, that is to know your personal data, is the first step for all life loggers: by collecting data about their behavior they can compare their subjective perception of movements, food intake etc. with the reality. And get meaning from that, such as: “Ah, I see – I don’t run 10 kilometers every second day but I run 7.5 kilometers twice a week – on average.”
After having learned about oneself, the user takes action – the second degree of meaning: she buys new running shoes to please herself and then she extends her weekly parcours to 10 kilometers, completed every second day. Lesson learned, quality of life of the individual improved.
The third degree of meaning would be added, when people get advice to make better use of their – and other people’s – data in the moments when decisions are actually made. A basic requirement for the third degree is that people (anonymously) share their personal data.
Matthew and Nikki prefer a Quantified Us approach to the Quantified Self. They call for groups of like-minded people quantifying themselves and sharing their data with each other. Apps which support those groups should help the users to make it easier to collect the data and to get a personal meaning from the data.
We could not phrase that better – and this is exactly the our approach at Datarella with our app explore: By asking our users questions we make it very easy for them to track those parts of their individual behavior which cannot be tracked by sensors but have to be added manually. She does not see a blank page which he has to fill by being highly creative , but by answering questionnaires, the user is guided and is able to add lots of contents in a very short time.
Second, explore user get feedback on their own behavior as well as the behavior of other users. They can use the answers of others as benchmark – and they see their individual position within the explore community.
These two aspects let every user provide their personal individual data as useful community data: by adding her own data, everybody is acting as an important piece of the puzzle. And, as known from P2P networks, such as Skype, the result for each individual will improve with every new participant in the network or community.
Coming back to Quantified Self vs Quantified Us: yes, we totally agree that the social – or community – factor is necessary for the movement to become socially relevant. But we think that the individual – the self – is the key factor in the game: the individual must decide to participate in one of the most important movements ever, or to stand still and rely on traditional eveolutionary mechanisms.
We’d love to read your thoughts on that!

by Michael Reuter | 1 April 2014 | Blockchain
From rapid urbanization in China to dung-fired stoves in New Delhi, air pollution claimed 7 million lives around the world in 2012, according to the World Health Organization. Globally, one out of every eight deaths is tied to dirty air – which makes air pollution the world’s single biggest environmental health risk. And, in areas with very bad air pollution, people live an average of 5 fewer years than those in other areas.
Not only in Chinese megacities or indian agricultural areas, people are trying hard to keep air pollution at bay. In Portland, Oregon, a local initiative called Neighbors for Clean Air is using Big Data to make bad air visible. The group is part of an experiment in initiated by Intel Labs, that uses 17 common, low-cost sensors, each weighing less than a pound to gather air quality data. This data feeds to websites that analyze and present comprehensible visualizations of the data. The sensors itself are built using an Arduino controller. They measure carbon and nitrogen dioxide emissions, temperature and humidity.
By making the air pollution problem visible, the experiment not only made people recognize the importance of technology in understanding air quality, but Neighbors for Clean Air could forego an agreement with a local metal foundry to cut emissions.
If you want to have a look at your own air pollution, go to Air Quality Egg – perhaps one of the several hundred eggs worldwide has been installed in your neighborhood.
by Michael Reuter | 28 March 2014 | Blockchain
If a technology wants to be respected it should demonstrate its social relevance. Then it will be approved by the people and its implications will be accepted. Otherwise it will be dead on arrival.
Generally, there are two different sorts of people: tech lovers and tech skeptics. The first are open to any innovation and happily embrace new technologies, products and services. The others look for risks and potentially negative implications of new tech. Ok – that may sound a little black and white – but for this post it helps. I think, if a new technology wants to be regarded as valuable, it should demonstrate social relevance. What do I mean with that? Let me explain using the example of or app explore.
A quick reminder for those who don’t now explore: the app helps you to learn more about yourself, your behavior. It does two things:
- it tracks you by collecting data from your smartphone’s sensors – like geolocation data, and
- it offers you questionnaires regarding your behavior to be answered by you.
The more questions you answer, the more does explore know about you and the better is the feedback you get from explore: your behavior, presented in nice-to-read graphs, with comparisons of your own behavior with that of other explore users. explore is a quantified self app, fully functional without any additional gadget.
The goal of explore is to help you improving the quality of your life. And that’s why you provide explore with your personal data: you will learn a lot about yourself – how you behave in certain situations and how this correlates with other factors, such as weather conditions, your individual communication behavior, your stress level, etc. If, for instance, you don’t feel well for the last few days, explore might find out a strong correlation with a higher than normal coffee intake. And since we all forget quickly – we even don’t remember what we did last Monday – explore supports you by showing your behavior in a time line. That might be the first time you don’t have to speculate about the reason for your not-so-well-being, but you actually see the reason!
“The first thing you have to know is yourself. A man who knows himself can step outside himself and watch his own reactions like an observer.”
Adam Smith
We are individuals, all of us are different. There is no standard recipe for illnesses or bad feelings. There are as many recipes as there are people. And this is where explore comes in: since you provide explore with your individual data, you will get individual feedback and recommendations about what to change, if necessary. And here we are: I think that our app explore – and its behavioral analytics in the background – is socially relevant.
3 Aspects of explore’s Social Relevance
- Everybody can use explore. The app is free and there is no need of using an additional gadget like a fitness band, or else. It’s in your smartphone – with you all the time.
- It’s absolutely easy to participate: explore asks the right questions at the right time – nobody must be overly creative and fill in an empty diary – just answer short questionnaires in under a minute.
- Users get individual personalized recommendations to change their behavior, if necessary. No standards, but individual advice.
For me, it’s absolutely great to work with a product (and a team, of course!) that helps people to change their lives for the better. Depending on the usage and the individual user, these might be minor changes – but with every small improvement is a good one. And since human beings can only change themselves for the better by changing their behavior (and not by waiting, taking pills or expecting any other external help), explore is a well applicable tool. And then it becomes socially relevant.
Please send me your perspective on socially relevant technology – would love to discuss!

by Michael Reuter | 13 March 2014 | Blockchain
Neben unseren mobilen Studien fragen wir unsere Nutzer immer wieder nach Ihrer Meinung zu aktuellen Tagesthemen. Momentan ist der Steuer-Prozess um FC Bayern Präsident das nationale Top-Thema. Daher haben wir einige Fragen gestellt. Hier sind die Antworten:
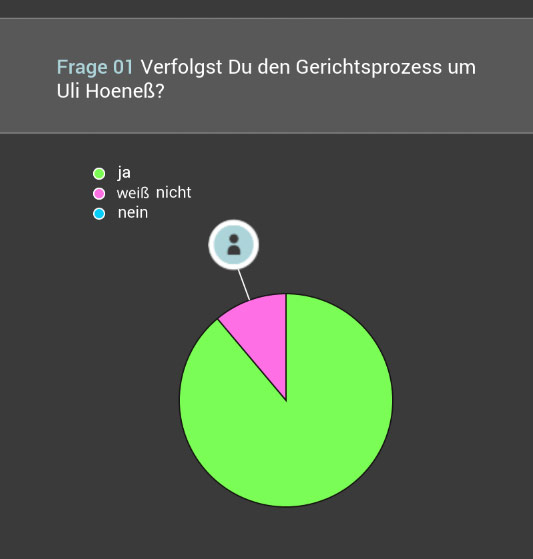
Frage 1: Verfolgst Du den Gerichtsprozess um Uli Hoeneß?
Antwort 1: knapp 90% der explore Teilnehmer verfolgen den Prozess.
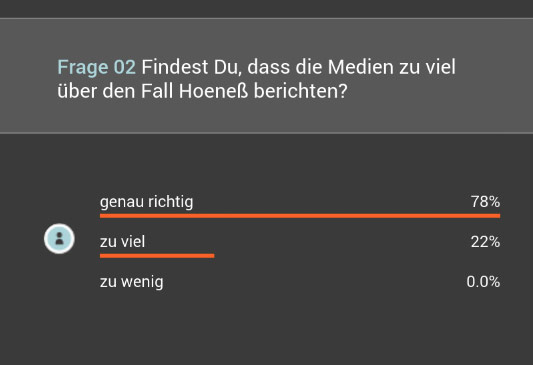
Frage 2: Findest Du, dass die Medien zuviel über den Fall Hoeneß berichten?
Antwort 2: Lediglich 22% geben an, genervt zu sein, weil so viel über den Fall berichtet wird.
Frage 3: Was glaubst Du, passiert mit Uli Hoeneß?
Antwort 3: 56% der Befragten sehen Uli Hoeneß im Gefängnis, 22% sehen ihn frei und ebenfalls 22% meinen, dass er sich ins Ausland absetzt.

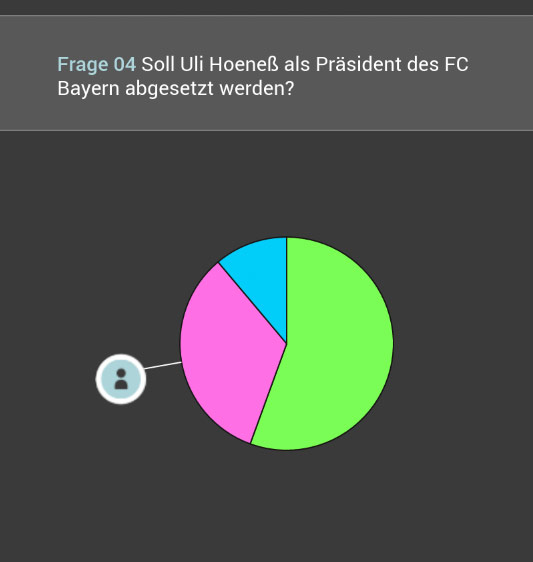
Frage 4: Soll Uli Hoeneß as Präsident des FC Bayern abgesetzt werden?
Antwort 4: Dass Uli Hoeneß nicht mehr der geeignete Präsident des FC Bayern ist, denken knapp über 50% der Befragten.
Wir sind gespannt, wie die Richter am Landgericht München II entscheiden werden – und ob sich Uli Hoeneß ins Ausland absetzt.
UPDATE:
Alea iacta est: Uli Hoeneß ist zu einer Haftstrafe von drei Jahren und sechs Monaten verurteilt worden. Nun kann er Revision beantragen. Den Gang ins Gefängnis müsste er erst antreten, wenn das Urteil rechtskräftig ist. (Wir glauben auch nicht, dass eine Flucht ins Ausland eine Option für Herrn Hoeneß ist.)
UPDATE 2
Uli Hoeneß verzichtet auf Revision und tritt den Gang ins Gefängnis an. Zudem tritt er von allen Ämtern mit sofortiger Wirkung zurück.

by Michael Reuter | 5 March 2014 | Blockchain
Wir suchen einen Ruby on Rails Entwickler per sofort!
Datarella erzählt die Geschichten hinter Daten: basierend auf der Research App ‚explore‘ entwickelt Datarella eine Behavioral Analytics Plattform mit integrierter Complex Event Processing Engine, die in Echtzeit das Verhalten von Teilnehmern analysiert. Nachdem Teilnehmer die App ‚explore‘ installiert haben, erhalten Sie in Abhängigkeit ihres Verhaltens Umfragen zugespielt. Die erhaltenen Antworten werden gemeinsam mit den erhobenen Sensordaten analysiert und ergeben ein klares Bild über Verhalten und Befindlichkeit der Teilnehmer.
Deine Aufgaben
Du wirst Datenbank und Web-Frontend für unsere App weiterentwickeln mittels Einbau, Mitenwicklung und Bug-Fixing neuer Features. Du setzt Features schnell und sicher in sauberen Rails-Code um. Du bist mitverantwortlich für die Sicherheit und Qualität des Backends. Wir bieten Dir einen spannenden Teilzeit-Job mit flexibler Zeiteinteilung. Du kannst von zuhause arbeiten und stehst in engem Kontakt mit unserem Entwicklerteam.
Deine Qualifikation
- Du hast sehr gute Ruby on Rails Kenntnisse
- Du hast Erfahrungen im Umgang mit Datenbanken (SQL, zB PostgreSQL, und idealer Weise auch MongoDB)
- Von Vorteil: Erfahrung in HTML, CSS, JavaScript, git
- Du entwickelst gerne in einem agilen Prozess
- Du hast gute kommunikative Fähigkeiten, eine strukturierte Arbeitsweise, kannst Dich selbst Organisieren und hast Teamgeist
- Du sprichst und schreibst gut Englisch
Bewirb Dich, indem Du eine email mit den relevanten Informationen über Dich an info (at) datarella (dot) com schreibst!
by Michael Reuter | 14 January 2014 | Blockchain
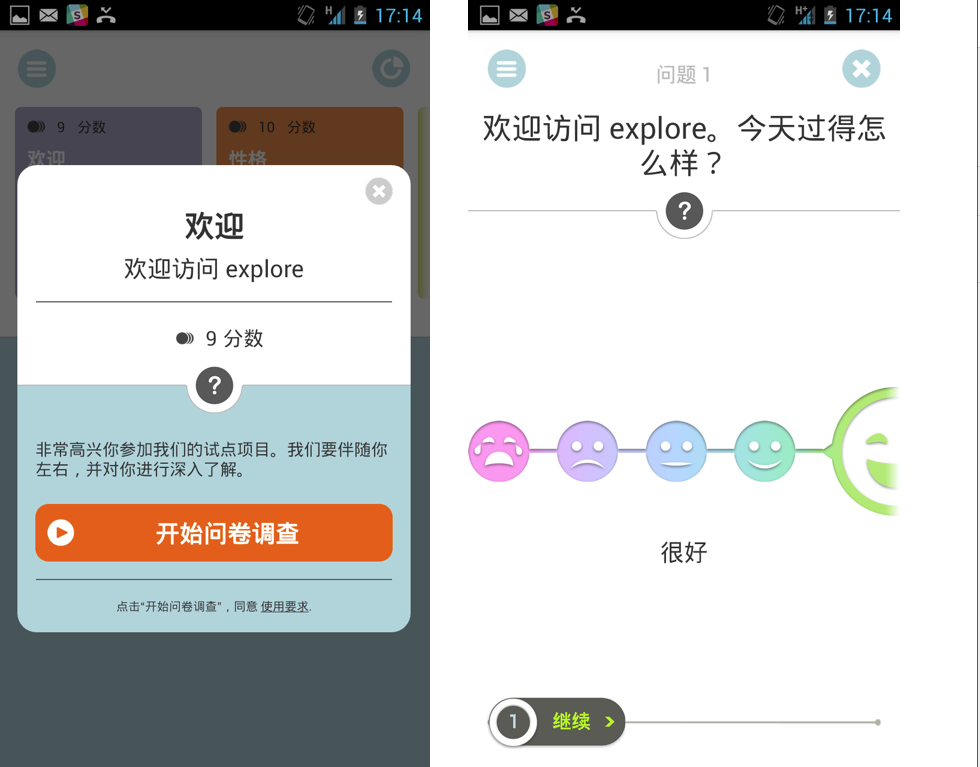
The Chinese version of the ‘explore’ app is ready for download. And that’s unique: right before the launch of the English version ist the Chinese app the first international version! It can be used for research in China itself or for surveys within the Chinese target group living abroad.
Download explore
by Michael Reuter | 14 January 2014 | Blockchain
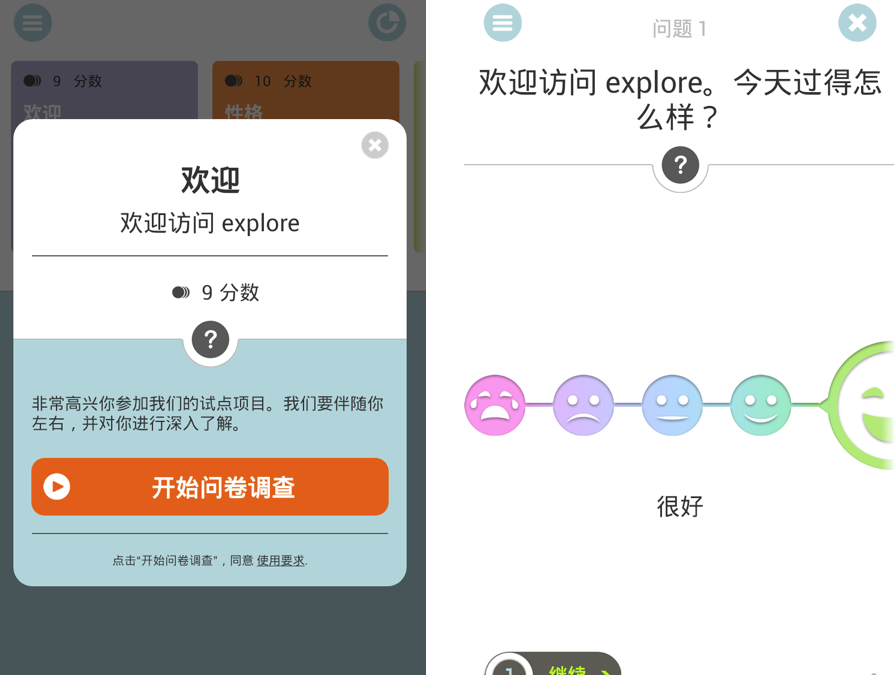
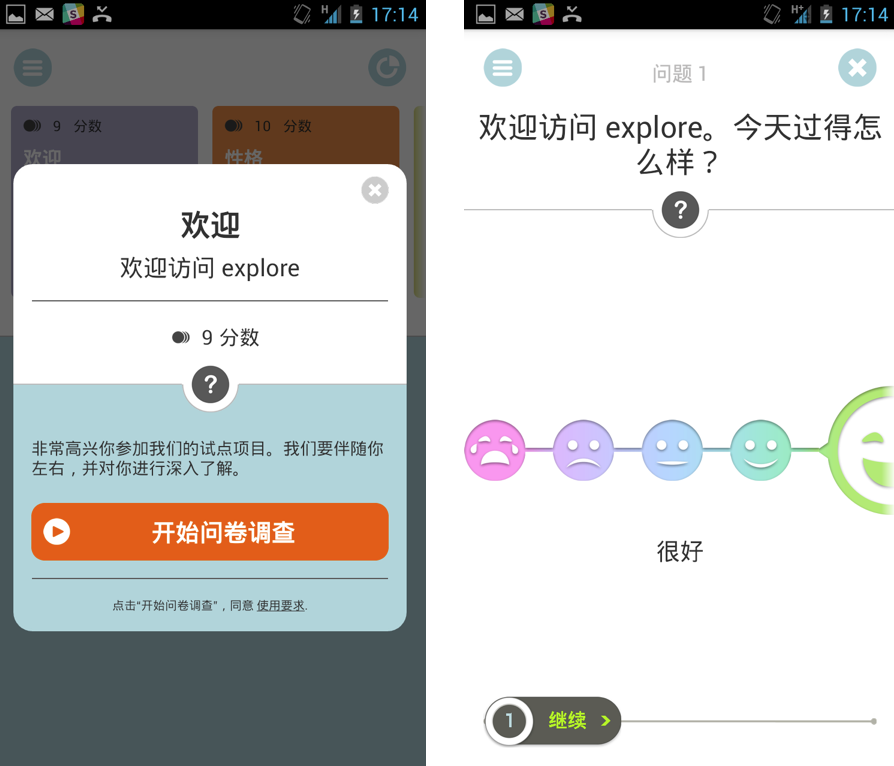
Die explore App steht ab sofort auch für den Einsatz in China zu Verfügung. Noch vor der englischen ist die chinesische Sprachversion von explore die erste Version für den internationalen Einsatz. Sie kann von interessierten Unternehmen ab sofort für Umfragen ihrer chinesischen Zielgruppen genutzt werden.
Download explore App
by Michael Reuter | 30 December 2013 | Blockchain
Seit Beginn Dezember läuft die explore App im Feldtest mit unserem Partner, der Serviceplan Gruppe. Mitarbeiter verschiedener Tochterunternehmen der Gruppe testen explore hinsichtlich Stabilität und Usability. Nach vier Wochen Test können wir erfreut melden: explore hat mit Bravour bestanden. Die App läuft rund und stabil – und wird nun im Januar auf ihre Einsatzmöglichkeiten im Feld geprüft.
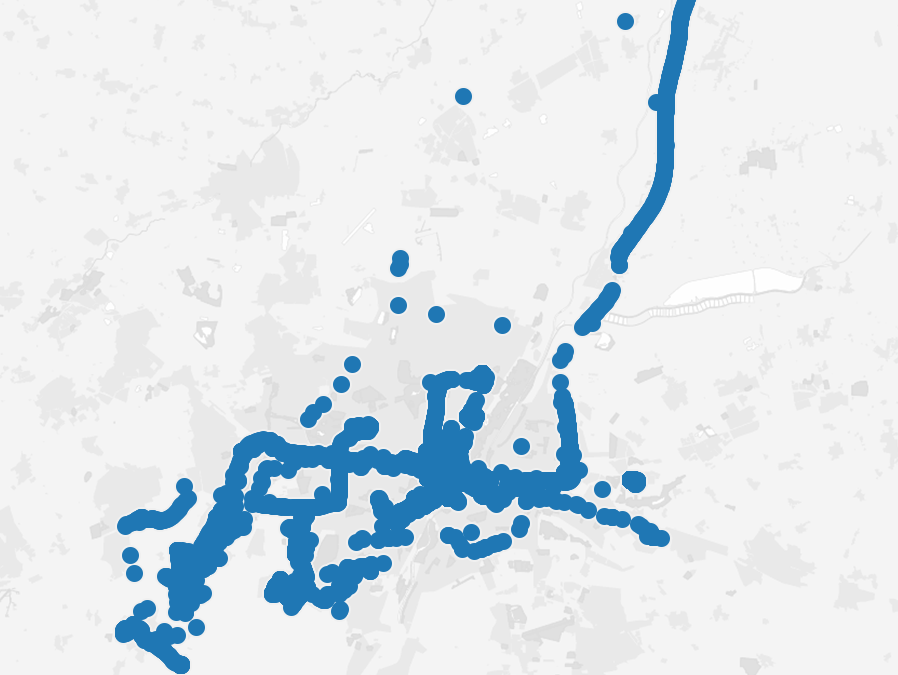
Main user locations explore app, December 2013 (Quelle: Datarella)
Die Nutzer der App haben sich schwerpunktmässig in Deutschland aufgehalten, aber auch in London, Polen, Thailand und an der Westküste der Vereinigten Staaten wurde explore eingesetzt, wie die obige Abbildung zeigt. Innerhalb Münchens markieren die aggregierten zurückgelegten Wege und Aufenthaltspunkte der explore Tester in anschaulicher Form die Hauptstrecken des öffentlich-rechtlichen Nahverkehrs inklusive der S-Bahn zum Flughafen, sowie die häufig frequentierten Bereiche der Münchner Innenstadt – mit Schwabing, Isarvorstadt und Sendling, sowie im Münchner Südwesten:
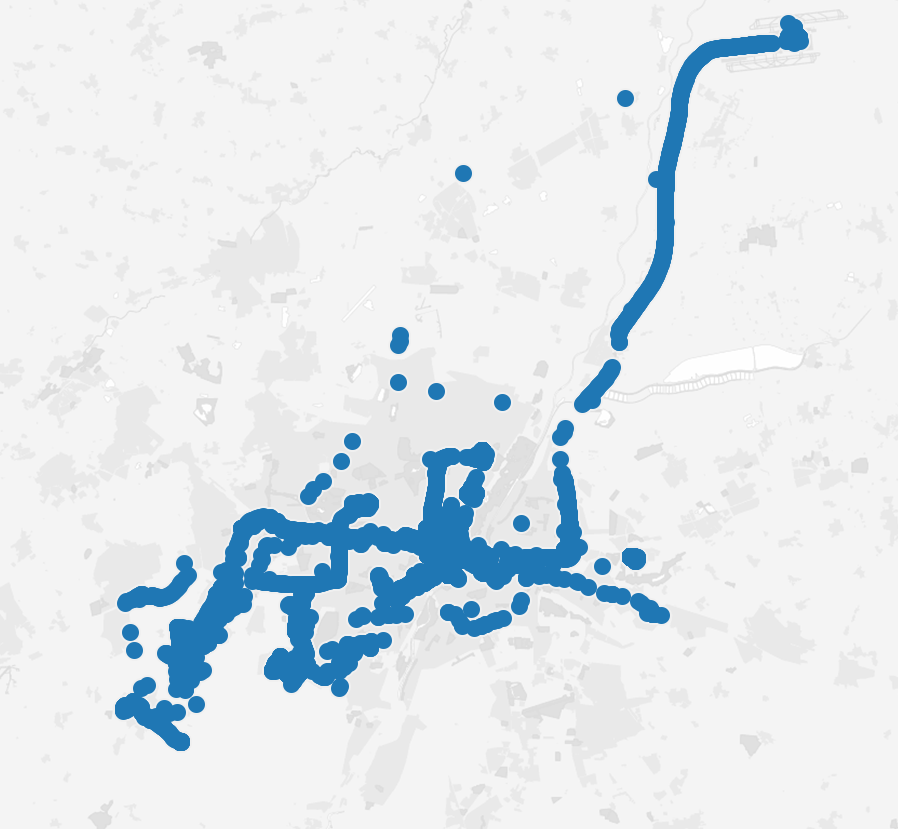
Main user locations within Greater Munich, explore app, December 2013 (Quelle: Datarella)
Alle explore Teilnehmer haben die GPS-Funktionalität über den gesamten Testzeitraum genutzt – niemand hat zur Option gegriffen, das Tracking im Profilbereich der App auszuschalten. Dies ist ein wichtiges Einzelergebnis des Tests: den Teilnehmern war diese Möglichkeit des Opt-out bewusst, keiner hat sich allerdings aktiv aus dem Tracking verabschiedet. Für das Datarella Team ein deutliches Indiz dafür, dass GPS-Tracking grundsätzlich vom Nutzer akzeptiert wird – zumindest wenn er einen Nutzen bzw. eine Sinnhaftigkeit in diesem Feature erkennt.
Das GPS-Tracking wurde im Test neben der Möglichkeit zur Erstellung individueller Wegstrecken dazu eingesetzt, den Nutzern an bestimmten Orten, an denen sie sich aufhielten, Fragen zu eben jenen Orten und korrespondierenden Aufenthalts-Zeiten zu stellen. Auf diese Weise konnte in Erfahrung gebracht werden, aus welchen Gründen sich Teilnehmer am Bahnhof aufhielten, und was sie dort – ausser beispielsweise mit dem Zug zu fahren – noch gemacht haben.
Neben den Fragen zu Aufenthaltsorten wurden im Test täglich bis zu 3 Umfragen mit jeweils bis zu 10 Einzelfragen durchgeführt. Diese Umfragen bezogen sich auf unterschiedliche Lebensbereiche: zum einen natürlich den Arbeitsplatz – bei einem Test mit Mitarbeitern eines Unternehmens eine Selbstverständlichkeit – zum anderen aber auch auf die Freizeitgestaltung sowie auf weitere Themen wie die allgemeine Befindlichkeit, Mediennutzung, Umweltbewusstsein und viele mehr. Als besonders wichtig bei Erhebung und Auswertung dieser Fragen hat sich eine optimale Mischung aus Bedienbarkeit der App (Usability) und Operationalisierbarkeit der Ergebnisse erwiesen.
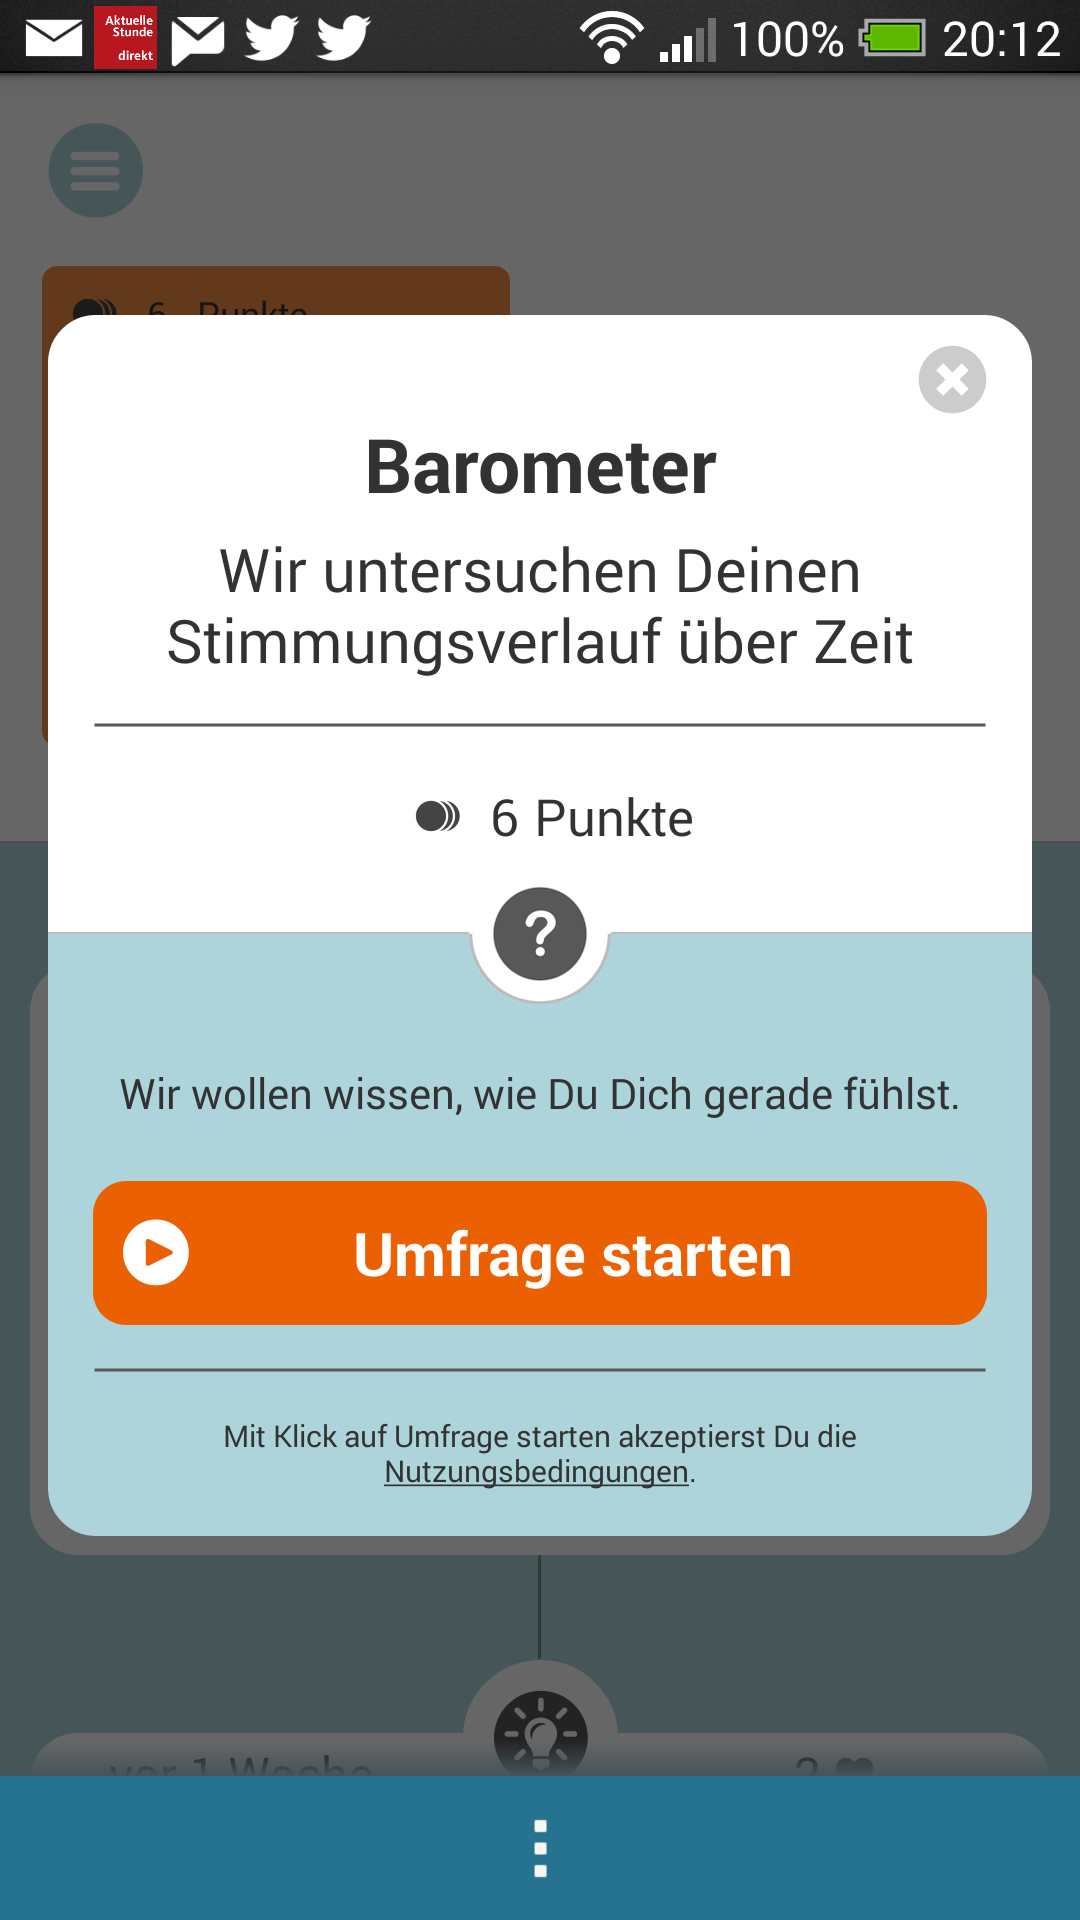
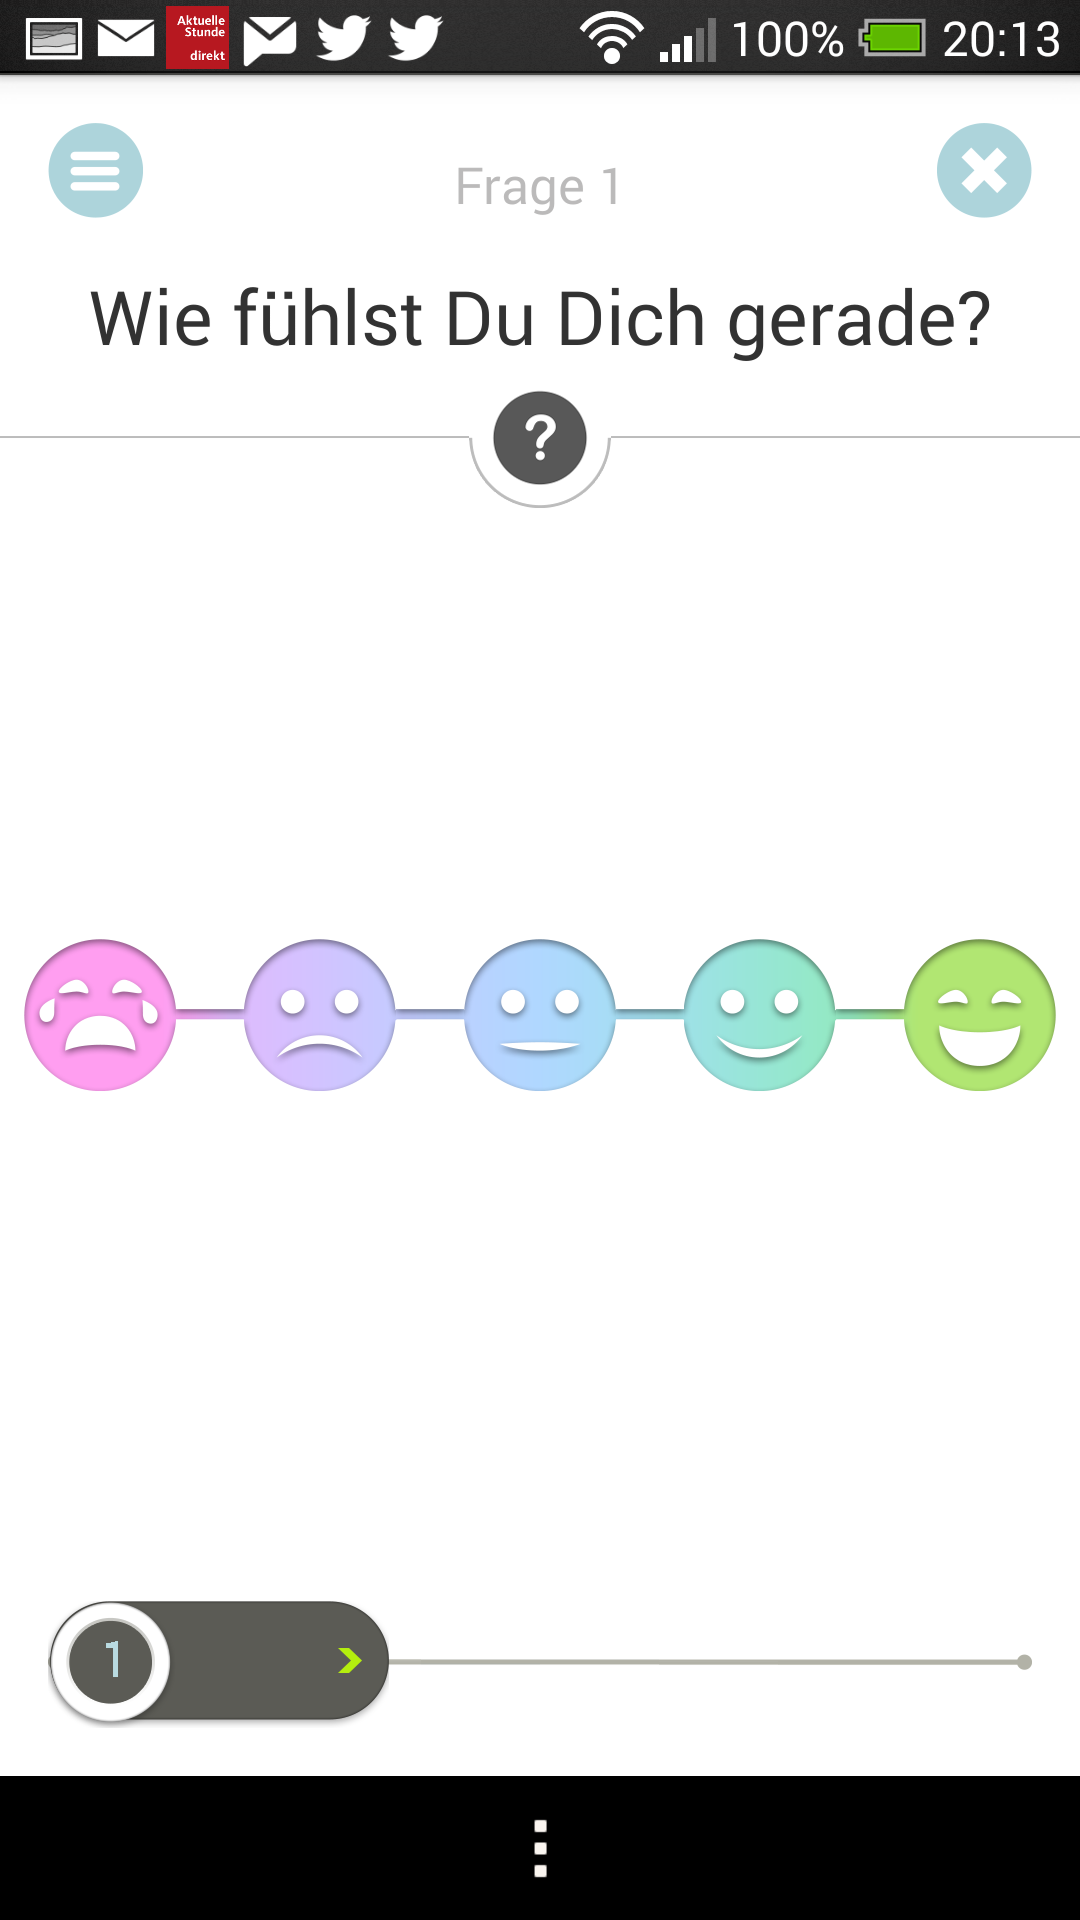
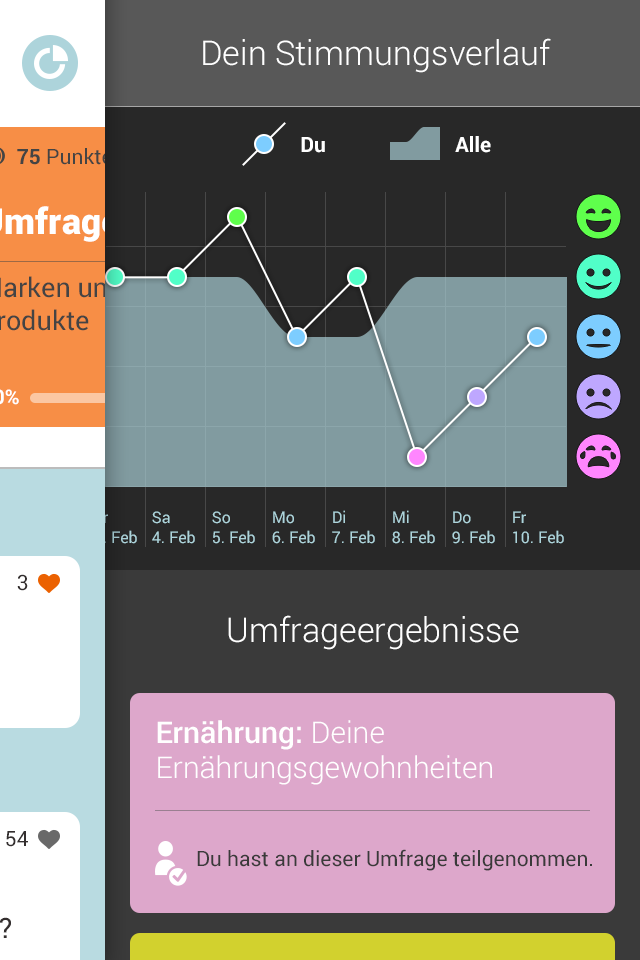
Umfrage: “Wie fühlst Du Dich gerade?”, explore App, Format: Smilies 1=sehr schlecht, 5=sehr gut (Quelle: Datarella)
So zeigt diese Abbildungen Frage-Format (in der explore App) und Antworten (im Backend) der Frage “Wie fühlst Du Dich gerade?” im Zeitraum 3.-18. Dezember. Die Frage ist Bestandteil der Barometer-Umfrage nach der persönlichen Befindlichkeit und kann vom Nutzer auf einer Skala mit fünf Smilies beantwortet werden. In der Auswertung bedeutet der Wert 1 das weinende Gesicht, der Wert 5 wird dem strahlenden Smiley gegeben. Diese Umfrage wurde den Teilnehmern wiederholt gestellt, damit der Stimmungsverlauf über die Zeit sichtbar ist.
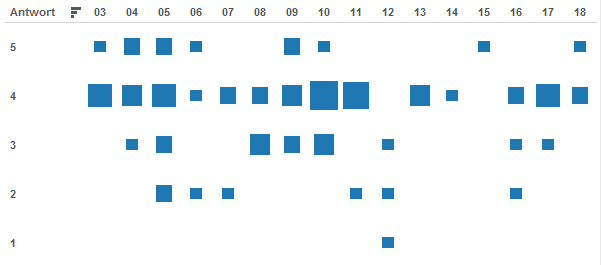
Umfrage: “Wie fühlst Du Dich gerade?”, explore App, Format: Smilies 1=sehr schlecht, 5=sehr gut (Quelle: Datarella)
Dies soll nur ein kleiner Ausschnitt aus den Ergebnissen des explore Feldtests sein. Wir freuen uns sehr, dass das Ergebnis so positiv ist und wir die App ab Januar auch einen grösseren Kreis zum Einsatz zur Verfügung stellen können. Dazu werden wir uns Anfang Januar in einem weiteren Beitrag auffordern. Wer Interesse an der Nutzung bzw. dem Einsatz von explore hat, kann sich gern an uns wenden. Die App befindet sich bereits in Google Play und kann heruntergeladen werden.
Wir bedanken uns herzlich bei allen Teilnehmern des Feldtests und freuen uns auf eine Fortsetzung im erweiterten Kreis ab Januar! Allen Lesern wünschen wir einen guten Start ins Jahr 2014!
